trading techniques
Charts And Checkpoints
Context Is Everything
This is how you use stock and index charts to determine market context.
You do not have to be a Chartered Market Technician to understand how market context can influence the price behavior of stocks. No stock is an island, and how a stock behaves is often a function of the market at large, which in turn is a function of underlying conditions — the context within which any particular market environment is developing.
In the simplest of terms, we know that in a bull market, most stocks go up, and in a bear market, most stocks go down, so this basic idea that market context can provide meaningful clues when studying stock charts is already something we are familiar with when we speak of bull and bear market environments.
It’s the context
While the use of stock charts can be very complex, often the exercise of comparing the price behavior of a stock to a chart of the market as represented by, for example, a major market index such as the Nasdaq Composite Index or the Standard & Poor’s 500 can help you understand a stock’s potential strength. You are also able to better understand why certain price movements are evident in a stock’s overall price chart. When it comes to understanding the price/volume behavior of stocks, context is everything.

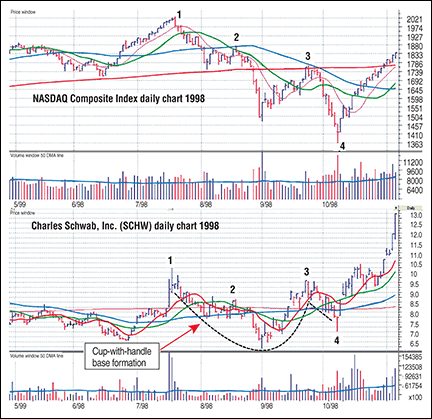
Figure 1: a cup with a jagged handle. The NASDAQ came down in a series of three very sharp waves. As the NASDAQ was approaching a top in July at point 1, SCHW was attempting to emerge from a sideways consolidation on brisk volume. Note the powerful countertrend move in SCHW when the NASDAQ bottoms at point 4. This could be the deciding factor in purchasing shares of SCHW.