TRADERS’ TIPS
May 2011
Here is this month’s selection of Traders’ Tips, contributed by various developers of technical analysis software to help readers more easily implement some of the strategies presented in this and other issues.
Other code appearing in articles in this issue is posted in the Subscriber Area of our website at https://technical.traders.com/sub/sublogin.asp. Login requires your last name and subscription number (from mailing label). Once logged in, scroll down to beneath the “Optimized trading systems” area until you see “Code from articles.” From there, code can be copied and pasted into the appropriate technical analysis program so that no retyping of code is required for subscribers.
You can copy these formulas and programs for easy use in your spreadsheet or analysis software. Simply “select” the desired text by highlighting as you would in any word processing program, then use your standard key command for copy or choose “copy” from the browser menu. The copied text can then be “pasted” into any open spreadsheet or other software by selecting an insertion point and executing a paste command. By toggling back and forth between an application window and the open web page, data can be transferred with ease.
This month’s tips include formulas and programs for:
- TRADESTATION: VOLUME ZONE OSCILLATOR
- eSIGNAL: VOLUME ZONE OSCILLATOR
- BLOOMBERG: VOLUME ZONE OSCILLATOR
- WEALTH-LAB: VOLUME ZONE OSCILLATOR
- AMIBROKER: VOLUME ZONE OSCILLATOR
- TC2000: VOLUME ZONE OSCILLATOR
- NEUROSHELL TRADER: VOLUME ZONE OSCILLATOR
- AIQ: VOLUME ZONE OSCILLATOR
- TRADERSSTUDIO: VOLUME ZONE OSCILLATOR
- STRATASEARCH: VOLUME ZONE OSCILLATOR
- TRADINGSOLUTIONS: VOLUME ZONE OSCILLATOR
- TRADECISION: VOLUME ZONE OSCILLATOR
- NINJATRADER: VOLUME ZONE OSCILLATOR
- UPDATA: VOLUME ZONE OSCILLATOR
- CHARTSY: VOLUME ZONE OSCILLATOR
- SHARESCOPE: VOLUME ZONE OSCILLATOR
- GENESIS: VOLUME ZONE OSCILLATOR
- MICROSOFT EXCEL: VOLUME ZONE OSCILLATOR
- VT TRADER: JM INTERNAL BAND TRADING STRATEGY
- VOLUME ZONE OSCILLATOR — KHALIL & STECKLER ARTICLE CODE

TRADESTATION: VOLUME ZONE OSCILLATOR
In the article “In The Volume Zone” in this issue, authors Walid Khalil and David Steckler present a volume zone oscillator (Vzo) that can be used to incorporate both trending and oscillating price action. They also suggest some methods by which the Vzo can be used with other indicators and rules for trading.
We have prepared code for this indicator (_Vzo_Ind) and a strategy (_Vzo_Strategy). The strategy utilizes the 60-bar Ema of the close, the volume zone oscillator, and the 14-bar Adx. An Adx above 18 is considered trending, while below 18 is considered nontrending, according to the authors. Alerts were coded in the indicator to alert when the Vzo crosses the overbought and oversold values as set by the inputs.
To download the EasyLanguage code for the indicator, go to the TradeStation and EasyLanguage Support Forum (https://www.tradestation.com/Discussions/forum.aspx?Forum_ID=213) and search for the file “Vzo.Eld.” The code is also shown here. A sample chart is shown in Figure 1.
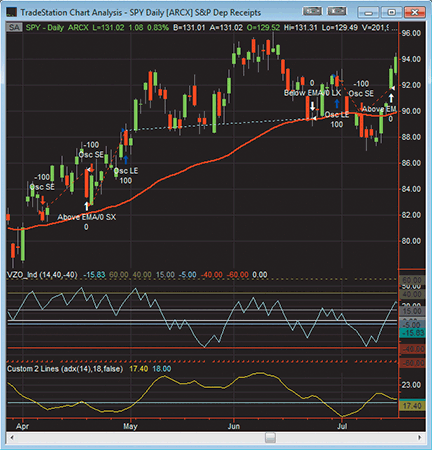
Figure 1: TRADESTATION, volume zone oscillator. This shows a daily chart of SPY with several indicators and the “_VZO_Strategy” applied. The indicators include the _VZO_Ind (cyan plot in subgraph 2), 60-bar EMA of the close (red plot with the price data), and the custom two-lines indicator (subgraph 3) plotting the 14-bar ADX (yellow) and the value of 18 (cyan line). The value of 18 for the ADX is the breakpoint for trending versus nontrending, according to the authors.
_VZO_Ind (Indicator)

{ TASC Article, May, 2011, "In The Volume Zone" }
{ Volume Zone Oscillator }

inputs:
	Period( 14 ),
	OverBought( 40 ),
	OverSold( -40 ) ;

variables:
	MV( 0 ),
	R( 0 ),
	VP( 0 ),
	TV( 0 ),
	VZO( 0 ) ;

MV = Iff(BarType >= 2 and BarType < 5, Volume, Ticks) ;
R = Sign( C - C[1] ) * MV ;
VP = XAverage( R, Period ) ;
TV = XAverage( MV, Period ) ;

if TV <> 0 then	VZO = VP / TV * 100 ;

Plot1( VZO, "VZO" ) ;
Plot2( 60, "+60" ) ;
Plot3( 40, "+40" ) ;
Plot4( 15, "+15" ) ;
Plot5( -5, "-5" ) ;
Plot6( -40, "-40" ) ;
Plot7( -60, "-60" ) ;
Plot8( 0, "Zero" ) ;

if VZO crosses above OverBought then
	Alert( "VZO Overbought" ) ;

if VZO crosses below OverSold then
	Alert( "VZO Oversold" ) ;


_VZO_Strategy (Strategy)

{ TASC Article, May, 2011, "In The Volume Zone" }
{ Volume Zone Oscillator Strategy }

[IntrabarOrderGeneration = false]

inputs:
	Period( 14 ), { Volume Zone Oscillator Length }
	EMALen( 60 ), { Number of bars for EMA }
	ADXLen( 14 ), { Length for ADX }
	ADXTrendAmt( 18 ), { ADX Value for Trend }
	OverBought( 40 ), { VZO overbought value }
	OverSold( -40 ) ; { VZO oversold value }

variables:
	EMA( 0 ),
	ADXTrending( false ),
	MV( 0 ),
	R( 0 ),
	VP( 0 ),
	TV( 0 ),
	VZOMaxHigh( 0 ),
	MaxCompare( 0 ),
	VZOMinLow( 0 ),
	MinCompare( 0 ),
	PrevPriceHigh( 9999999 ),
	PrevPriceLow( 0 ),
	BullishDiv( false ),
	BearishDiv( false ),
	PrevVZOHigh( 0 ),
	PrevVZoLow( 0 ),
	VZO( 0 ) ;

EMA = XAverage( C, EMALen ) ; { EMA of the Close }
ADXTrending = ADX( ADXLen ) > ADXTrendAmt ;
MV = Iff(BarType >= 2 and BarType < 5, Volume, Ticks) ;
R = Sign( C - C[1] ) * MV ;
VP = XAverage( R, Period ) ;
TV = XAverage( MV, Period ) ;

if TV <> 0 then
	VZO = VP / TV * 100 ;

MaxCompare = Iff( ADXTrending, 60, 40 ) ;
MinCompare = Iff( ADXTrending, -60, -40 ) ;

if VZO > MaxCompare then
	VZOMaxHigh = MaxList( VZOMaxHigh, VZO )
else
	VZOMaxHigh = -999 ;

if VZO < MinCompare then
	VZOMinLow = MinList( VZOMinLow, VZO )
else
	VZOMinLow = 999 ;

{ Pivot High of VZO - look for divergence }
if PivotHighVSBar( 1, VZO, 1, 1, 2 ) <> -1 then
	begin
	if H[1] > PrevPriceHigh and
		VZO[1] < PrevVZOHigh then
			BearishDiv = true
	else
		BearishDiv = false ;
	PrevPriceHigh = H[1] ;
	PrevVZOHigh = VZO[1] ;
	end
else
	BearishDiv = false ;

{ Pivot Low of VZO - look for divergence }
if PivotLowVSBar( 1, VZO, 1, 1, 2 ) <> -1 then
	begin
	if L[1] < PrevPriceLow and
		VZO[1] > PrevVZOLow then
			BullishDiv = true
	else
		BullishDiv = false ;
	PrevPriceLow = L[1] ;
	PrevVZOLow = VZO[1] ;
	end
else
	BullishDiv = false ;

{------------------------------------------------
		ENTRIES
-------------------------------------------------}
{ Long Entry Conditions - Trending }
Condition1 = C > EMA and ADXTrending ;
Condition2 = VZO crosses above OverSold ;

if Condition1 and Condition2 then
	Buy ( "OS Rev LE" ) next bar market ;

if VZO crosses below 40 then
	Condition3 = true
else if VZO crosses below -40 then
	Condition3 = false ;

if Condition3 and VZO crosses above 0 then
	begin
	Condition4 = true ; { Long entry trigger }
	Condition3 = false ;
	end ;

if Condition1 and Condition4 then
	begin
	Buy ( "LE Trend 2" ) next bar market ;
	end ;


{ Short Entry Conditions - Trending }
Condition11 = C < EMA and ADXTrending ;
Condition12 = VZO crosses below OverBought ;

if Condition11 and Condition12 then
	SellShort ( "OB Rev SE" ) next bar market ;

if VZO crosses above -40 then
	Condition13 = true
else if VZO crosses above 40 then
	Condition13 = false ;

if Condition13 and VZO crosses below 0 then
	begin
	Condition14 = true ; { Short entry trigger }
	Condition13 = false ;
	end ;

if Condition11 and Condition14 then
	SellShort( "SE Trend 2" ) next bar market ;

{ Long Entry Conditions - Oscillating }
Condition21 = VZO crosses above 15 ;

Condition30 = ADXTrending = false and
	( Condition2 or Condition21 ) ;

if Condition30 then
	Buy ( "Osc LE" ) next bar market ;


{ Short Entry Conditions - Oscillating }
Condition31 = VZO crosses below -5 ;

Condition40 = ADXTrending = false and
	( Condition12 or Condition31 ) ;

if Condition40 then
	SellShort ( "Osc SE" ) next bar market ;

{------------------------------------------------
		EXITS
-------------------------------------------------}
{ Long Exits - Trending }

if ADXTrending then
	if ( VZO > 60 and VZO < VZOMaxHigh ) or
		VZO crosses below 60 then
		Sell ("VZO Rev Trend LX" ) next bar market ;

{ Divergence Exit }
if ADXTrending and CurrentBar > 50 and BearishDiv and
	VZO crosses below 40 then
		Sell ( "Div LX" ) next bar market ;

if ADXTrending and C < EMA and VZO < 0 then
	Sell ( "Below EMA/0 LX" ) next bar market ;


{ Short Exits - Trending }
if ADXTrending then
	if ( VZO < -60 and VZO > VZOMinLow ) or
	VZO crosses above -60 then
	BuyToCover ( "VZO Rev Trend SX" ) next bar market ;

{ Divergence Exit }
if ADXTrending and CurrentBar > 50 and BullishDiv
	and VZO crosses above -40 then
		BuyToCover ( "Div SX" ) next bar market ;

if ADXTrending and C > EMA and VZO > 0 then
	BuyToCover ( "Above EMA/0 SX" ) next bar market ;


{ Long Exits - Oscillating }
if ADXTrending = false then
	if ( VZO > 40 and VZO < VZOMaxHigh ) or
		VZO crosses below 40 then
		Sell ("VZO Rev Osc LX" ) next bar market ;

if ADXTrending = false and VZO crosses below -5 then
	Sell ( "Osc LX" ) next bar market ;

{ Short Exits - Oscillating }
if ADXTrending = false then
	if ( VZO < -40 and VZO > VZOMinLow ) or
		VZO crosses above -40 then
	BuyToCover ( "VZO Rev Osc SX" ) next bar market ;

if ADXTrending = false and VZO crosses above 15 then
	BuyToCover ( "Osc SX" ) next bar market ;

Condition4 = false ;
Condition14 = false ;
This article is for informational purposes. No type of trading or investment recommendation, advice, or strategy is being made, given, or in any manner provided by TradeStation Securities or its affiliates.

eSIGNAL: VOLUME ZONE OSCILLATOR
For this month’s Traders’ Tip, we’ve provided the formula VolumeZoneOsc.efs based on the formula code from Walid Khalil and David Steckler’s article in this issue, “In The Volume Zone.”
The study contains one formula parameter to set the number of periods, which may be configured through the Edit Chart window.
To discuss these studies or download complete copies of the formula code, please visit the Efs Library Discussion Board forum under the Forums link from the Support menu at www.esignal.com or visit our Efs KnowledgeBase at https://www.esignal.com/support/kb/efs/. The eSignal formula scripts (Efs) are also shown here as text.
A sample chart is shown in Figure 2.
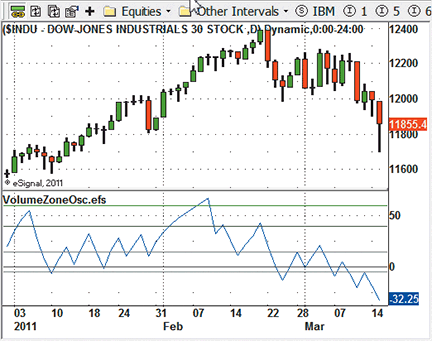
Figure 2: eSIGNAL, volume zone oscillator
VolumeZoneOsc.efs

/*********************************
Provided By:
    Interactive Data Corporation (Copyright © 2011)
    All rights reserved. This sample eSignal Formula Script (EFS)
    is for educational purposes only. Interactive Data Corporation
    reserves the right to modify and overwrite this EFS file with
    each new release.

Description:
    The Volume Zone Oscillator

Version: 1.0  14/03/2011

        Formula Parameters: Default:
                Period         14


Notes:
    The related article is copyrighted material. If you are not
    a subscriber of Stocks & Commodities, please visit www.traders.com.

**********************************/


var fpArray = new Array();

var bVersion = null;

function preMain()

{

    setCursorLabelName("Volume Zone Osc", 0);


    var x=0;
    fpArray[x] = new FunctionParameter("gPeriod", FunctionParameter.NUMBER);
    with(fpArray[x++])
    {
	setName("Period");
	setLowerLimit(1);
        setDefault(14);
    }

    fpArray[x] = new FunctionParameter("gLevels", FunctionParameter.BOOLEAN);
    with(fpArray[x++])
    {
	setName("Show Levels");
        setDefault(true);
    }

}

bInit = false;

var xVol = null;

var xR = null;

var xVP = null;

var xTV = null;

function main(gPeriod, gLevels)

{


    if (bVersion == null) bVersion = verify();

    if (bVersion == false) return;


    if (!bInit)

    {

        xVol = volume();

        xR = efsInternal("calcSignedVol", xVol, close());

        xVP = ema(gPeriod, xR);

        xTV = ema(gPeriod, xVol);

        if ( gLevels )

        {

                addBand(60, PS_SOLID, 1, Color.green, "lev60");

                addBand(40, PS_SOLID, 1, Color.darkgreen, "lev40");

                addBand(15, PS_SOLID, 1, Color.grey, "lev15");

                addBand(0, PS_SOLID, 1, Color.darkgrey, "lev0");

                addBand(-5, PS_SOLID, 1, Color.grey, "lev5n");

                addBand(-40, PS_SOLID, 1, Color.maroon, "lev40n");

                addBand(-60, PS_SOLID, 1, Color.red, "lev60n");

        }

        bInit = true;

    }

    var vVP = xVP.getValue(0);

    var vTV = xTV.getValue(0);

    if ( vVP == null ) return null;

    var vVZO = 100;

    if ( vTV != 0 ) vVZO = 100 * vVP / vTV;

    return vVZO;


}


function calcSignedVol(xVol, xCls)

{

        var vVol = xVol.getValue(0);

        var vCls1 = xCls.getValue(-1);

        var vCls0 = xCls.getValue(0);

        if ( vCls1 == null ) return null;

        vVol = (vCls1 < vCls0)? vVol : -vVol;

        return vVol;

}


function verify() {

    var b = false;

    if (getBuildNumber() < 779) {

        drawTextAbsolute(5, 35, "This study requires version 8.0 or later.",

            Color.white, Color.blue, Text.RELATIVETOBOTTOM|Text.RELATIVETOLEFT|Text.BOLD|Text.LEFT,

            null, 13, "error");

        drawTextAbsolute(5, 20, "Click HERE to upgrade.@URL=https://www.esignal.com/download/default.asp",

            Color.white, Color.blue, Text.RELATIVETOBOTTOM|Text.RELATIVETOLEFT|Text.BOLD|Text.LEFT,

            null, 13, "upgrade");

        return b;

    } else {

        b = true;

    }

    return b;

}

BLOOMBERG: VOLUME ZONE OSCILLATOR
The Bloomberg chart in Figure 3 shows the volume zone oscillator described in the article by Walid Khalil and David Steckler in this issue, “In The Volume Zone.” Based on the uptrend rules given in the article, a bullish signal is present during December 2010 (defined by a rectangle) that coincides with the early stage of the rally that peaked in mid-February 2011. The oscillator crosses above the zero line on December 6, the final day on the chart where the entire bar is below the 60-day Ema. At that point, the Adx line hovers just around the 18 level, as evidenced by the orange line that cuts through the Adx histogram. Three days later, on December 9, the Vzo crossed back above +15, the market gapped above the 60-day Ema, and the Adx is close to 20, showing the strengthening of the up move.
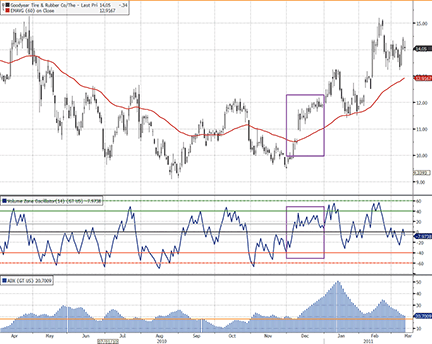
Figure 3: BLOOMBERG, volume zone oscillator. Here is a one-year daily chart of Goodyear Tire & Rubber (GT), with the volume zone oscillator and ADX shown in separate panels below the price chart.
In their article, the authors also note that the Vzo will react to that volume behavior by staying in the lower zone between -40 and zero, indicating more selling pressure than buying pressure. Conversely, on this chart, one can observe the Vzo oscillating in a range between zero and +40 as the market is in the first wave of the up move during the second half of December.
Using the CS.Net framework within the Stdy<GO> function on the Bloomberg Terminal, C# code or Visual Basic code can be written to display the volume zone oscillator. The C# code for this indicator is shown at Traders.com. All Bloomberg code written for Traders’ Tips can also be found in the sample files provided with regular Sdk updates, and the studies will be included in the Bloomberg global study list.
Bloomberg code for volume zone oscillator

using System;
using System.Collections.Generic;
using System.Text;
using System.Drawing;
using Bloomberg.Study.API;
using Bloomberg.Study.CoreAPI;
using Bloomberg.Study.Util;
using Bloomberg.Study.TA;
using Bloomberg.Math;

namespace Volume_Zone_Oscillator
{

    public partial class VolumeZoneOscillator
    {
        //Create the user defineable input 'Period' to use in the EMA's
        public StudyIntegerProperty Period = new StudyIntegerProperty(14);

        private void Initialize()
        {
            //Create a Study Panel beneath the price chart panel
            Panels.Add("VZOPanel", new StudyPanel());

            //Create the Volume Zone Oscillator Line
            Output.Add("VZO", new TimeSeries());
            StudyLine vzoLine = new StudyLine("VZO", Color.Blue);
            Panels["VZOPanel"].Visuals.Add("VZO", vzoLine);
            vzoLine.DisplayName = "Volume Zone Oscillator";
            //Display user defined period on VZO legend
            vzoLine.SetDisplayNameSuffix(Period);

            //Add horizontal to show the oscillator levels referenced within the Trader's Tips column
            Output.Add("Level1", new TimeSeries());
            StudyHorizontalLine Level1 = new StudyHorizontalLine(60, Color.Green, VisualLineStyle.Solid);
            Level1.Style = VisualLineStyle.Dot;
            Level1.Width = 4;
            Panels["VZOPanel"].Visuals.Add("Level1", Level1);
            Level1.DisplayName = "+60";

            Output.Add("Level2", new TimeSeries());
            StudyHorizontalLine Level2 = new StudyHorizontalLine(40, Color.Green, VisualLineStyle.Solid);
            Level2.Width = 2;
            Panels["VZOPanel"].Visuals.Add("Level2", Level2);
            Level2.DisplayName = "+40";

            Output.Add("Level3", new TimeSeries());
            StudyHorizontalLine Level3 = new StudyHorizontalLine(15, Color.DarkGray, VisualLineStyle.Solid);
            Level3.Width = 2;
            Panels["VZOPanel"].Visuals.Add("Level3", Level3);
            Level3.DisplayName = "+15";

            Output.Add("ZeroLine", new TimeSeries());
            StudyHorizontalLine zeroline = new StudyHorizontalLine(0, Color.Black, VisualLineStyle.Solid);
            zeroline.Width = 2;
            Panels["VZOPanel"].Visuals.Add("ZeroLine", zeroline);
            zeroline.DisplayName = "0";

            Output.Add("Level4", new TimeSeries());
            StudyHorizontalLine Level4 = new StudyHorizontalLine(-5, Color.DarkGray, VisualLineStyle.Solid);
            Level4.Width = 2;
            Panels["VZOPanel"].Visuals.Add("Level4", Level4);
            Level4.DisplayName = "-5";

            Output.Add("Level5", new TimeSeries());
            StudyHorizontalLine Level5 = new StudyHorizontalLine(-40, Color.Red, VisualLineStyle.Solid);
            Level5.Width = 2;
            Panels["VZOPanel"].Visuals.Add("Level5", Level5);
            Level5.DisplayName = "-40";

            Output.Add("Level6", new TimeSeries());
            StudyHorizontalLine Level6 = new StudyHorizontalLine(-60, Color.Red, VisualLineStyle.Solid);
            Level6.Style = VisualLineStyle.Dot;
            Level6.Width = 4;
            Panels["VZOPanel"].Visuals.Add("Level6", Level6);
            Level1.DisplayName = "-60";

            //Here we create a new field based on the internal Bloomberg field of Volume
            DataField volumeData = new DataField("PX_VOLUME");
            Input.Add("Volume", volumeData);

        }

        public override void Calculate()
        {
            TimeSeries close = Input.Close;
            TimeSeries Volume = Input["Volume"];
            TimeSeries R = new TimeSeries(close.Count);


            for (int ii = 1; ii < close.Count; ii++)
            {
                if (close[ii] < close[ii - 1])
                {
                    R[ii] = Volume[ii] * -1;
                }
                else
                {
                    R[ii] = Volume[ii];
                }
            }

            TimeSeries VP = Indicator.EMAvg(R, Period.Value);
            TimeSeries TV = Indicator.EMAvg(Volume, Period.Value);
            TimeSeries VZO = 100 * (VP / TV);

            Output.Update("VZO", VZO);

        }

    }

}

WEALTH-LAB: VOLUME ZONE OSCILLATOR
The volume zone oscillator system presented in Walid Khalil and David Steckler’s article in this issue, “In the Volume Zone,” is now available as a free download to Wealth-Lab users, as well as many other ready-made trading strategies. The code is also shown here as text.
C# code for Wealth-Lab:

using System;
using System.Collections.Generic;
using System.Text;
using System.Drawing;
using WealthLab;
using WealthLab.Indicators;
using Community.Components; // Divergence Between Two DataSeries (Detect, Plot)

namespace WealthLab.Strategies
{
	public class VZOStrategy : WealthScript
	{
		private StrategyParameter paramPeriod;

		public VZOStrategy()
		{
			paramPeriod = CreateParameter("VZO Period", 14, 2, 252, 2);
		}

		protected override void Execute()
		{
			int period = paramPeriod.ValueInt;
			DataSeries R = new DataSeries( Bars, "R" );
			DataSeries TV = EMA.Series( Volume, period, EMACalculation.Modern );
			DataSeries VZO = new DataSeries( Bars, "VZO" );
			ADX adx = ADX.Series( Bars,14 );
			EMA ema = EMA.Series( Close, 60, EMACalculation.Modern );

			for(int bar = period; bar < Bars.Count; bar++) {
				R[bar] = Math.Sign( Close[bar] - Close[bar-1] ) * Volume[bar];
			}
			DataSeries VP = EMA.Series( R, period, EMACalculation.Modern );

			for(int bar = period; bar < Bars.Count; bar++) {
				if( TV[bar] != 0 )
					VZO[bar] = 100 * VP[bar] / TV[bar];
			}

			ChartPane vzoPane = CreatePane( 30, true, true );
			PlotSeriesOscillator( vzoPane, VZO, 60, -60, Color.Red, Color.Blue, Color.Black, LineStyle.Solid, 1 );
			DrawHorzLine( vzoPane, 60, Color.DarkGreen, LineStyle.Dotted, 2 );
			DrawHorzLine( vzoPane, -60, Color.Red, LineStyle.Dotted, 2 );
			DrawHorzLine( vzoPane, 40, Color.DarkGreen, LineStyle.Solid, 1 );
			DrawHorzLine( vzoPane, -40, Color.Red, LineStyle.Solid, 1 );
			DrawHorzLine( vzoPane, 0, Color.DarkBlue, LineStyle.Solid, 1 );

			ChartPane divPane = CreatePane( 30, true, true );
			SeriesHelper sh = new SeriesHelper(this);
			DataSeries pd = sh.PlotPeakDivergence(3, PricePane, High, 4d, vzoPane, VZO, 4d);
			PlotSeries(divPane, pd, Color.Blue, LineStyle.Solid, 2);
			DataSeries td = sh.PlotTroughDivergence(3, PricePane, Low, 4d, vzoPane, VZO, 4d);
			PlotSeries(divPane, td, Color.Red, LineStyle.Solid, 2);

			ChartPane adxPane = CreatePane( 30, true, true );
			PlotSeries(adxPane, adx, Color.Purple, LineStyle.Histogram, 2);
			DrawHorzLine(adxPane, 18, Color.Red, LineStyle.Dashed, 2 );
			PlotSeries(PricePane, ema, Color.Blue, LineStyle.Solid, 1);

			int start = Math.Max(adx.FirstValidValue,period);
			start = Math.Max( start, ema.FirstValidValue );

			for(int bar = start; bar < Bars.Count; bar++)
			{
				bool bull = adx[bar] > 18 && Close[bar] > ema[bar];
				bool bear = adx[bar] > 18 && Close[bar] < ema[bar];
				bool osc = adx[bar] < 18;

				if( bull ) SetBackgroundColor( bar, Color.FromArgb( 30, Color.Blue ) );
				if( bear ) SetBackgroundColor( bar, Color.FromArgb( 30, Color.Red ) );
				if( osc ) SetBackgroundColor( bar, Color.FromArgb( 30, Color.Green ) );

				if (IsLastPositionActive)
				{
					Position p = LastPosition;
					if( p.PositionType == PositionType.Long ) {
						if( p.EntrySignal.ToLower().Contains("uptrend") ) {
							if( VZO[bar] > 60 && TurnDown( bar, VZO ) ||
								( Close[bar] < ema[bar] && VZO[bar] < 0 ) ||
								(pd[bar] <= -1.0 && VZO[bar] < 40.0) )
								SellAtMarket( bar+1, p, "trend sell" );
						}
						else if( p.EntrySignal.ToLower().Contains("buy nontrend") ) {
							if( VZO[bar] > 40.0 ) {
								if( adx[bar] > 18 )
									SellAtMarket( bar+1, p, "nontrend sell rule #1" );
							}
							else {
								if( VZO[bar] < -5 )
									SellAtMarket( bar+1, p, "nontrend sell rule #2" );
							}
						}
					}
					else {
						if( p.EntrySignal.ToLower().Contains("downtrend") ) {
							if( VZO[bar] < -60 && TurnUp( bar, VZO ) ||
								( Close[bar] > ema[bar] && VZO[bar] > 0 ) ||
								(td[bar] <= -1.0 && VZO[bar] > -40.0) )
								CoverAtMarket( bar+1, p, "trend cover" );
						}
						else if( p.EntrySignal.ToLower().Contains("short nontrend") ) {
							if( VZO[bar] < -40.0 ) {
								if( adx[bar] > 18 )
									CoverAtMarket( bar+1, p, "nontrend cover rule #1" );
							}
							else {
								if( VZO[bar] < -5 && CrossOver( bar, VZO, 15 ) )
									CoverAtMarket( bar+1, p, "nontrend cover rule #2" );
							}
						}
					}
				}
				else
				{
					bool buy = bull && ( CrossOver( bar, VZO, -40 ) || CrossOver( bar, VZO, 0 ) );
					bool shrt = bear && ( CrossUnder( bar, VZO, 40 ) || CrossUnder( bar, VZO, 0 ) );
					bool nt_buy = osc && (CrossOver( bar, VZO, -40 ) || CrossOver( bar, VZO, 15 ));
					bool nt_shrt = osc && (CrossUnder( bar, VZO, 40 ) || CrossUnder( bar, VZO, -5 ));

					if( buy ) {
						SetBarColor( bar, Color.Blue );
						BuyAtMarket( bar+1, "buy uptrend" );
					}
					else if( shrt ) {
						SetBarColor( bar, Color.Red );
						ShortAtMarket( bar+1, "short downtrend" );
					}
					else if( nt_buy ) {
						SetBarColor( bar, Color.Cyan );
						BuyAtMarket( bar+1, "buy nontrend" );
					}
					else if( nt_shrt ) {
						SetBarColor( bar, Color.Orange );
						ShortAtMarket( bar+1, "short nontrend" );
					}
				}
			}
		}
	}
}
To start using this strategy and exploring its potential to help you switch gears to trade in both trending and range-bound markets, simply click the “Download” button in Wealth-Lab’s Open Strategy dialog.
Although the new oscillator implementation is fairly straightforward, the accompanying system rules have to function in different market regimes and cover such events as positive and negative price/oscillator divergences. The complexity of their implementation is hidden in an additional library, “Community Components,” available for download to Wealth-Lab customers from our site, www.wealth-lab.com (see the “Extensions” section). Users can see the divergence lines drawn on a chart, both in the traditional way and as a “binary wave” to be used in mechanical trading systems.
A sample chart is shown in Figure 4.
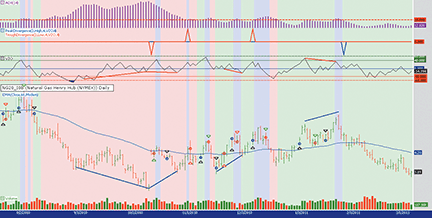
Figure 4: WEALTH-LAB, volume zone oscillator. Here is a Wealth-Lab Developer 6.1 chart showing the volume zone oscillator strategy applied to a natural gas continuous futures contract (NG20_I0B, daily).

AMIBROKER: VOLUME ZONE OSCILLATOR
In their article in this issue, “In The Volume Zone,” authors Walid Khalil and David Steckler present a new volume zone oscillator that can be easily implemented using AmiBroker Formula Language. A ready-to-use formula for the indicator can be found below.
To use the code, enter the formula in the Afl Editor, then press “Insert indicator.” To modify the averaging period of the volume zone oscillator, right-click on the chart and select “Parameters” from the context menu.
A sample chart is shown in Figure 5.
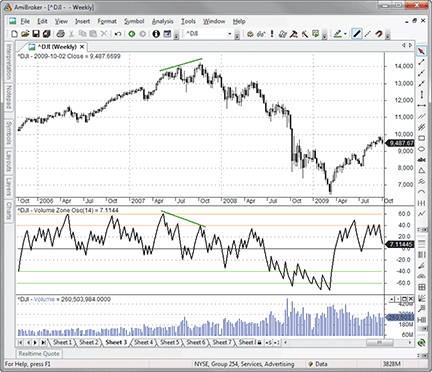
Figure 5: AMIBROKER, volume zone oscillator. Here is a weekly price chart of the DJIA (upper pane) with a 14-period volume zone oscillator (middle pane).
function VZO( Period )
{
 R = sign( Close - Ref( Close, -1 ) ) * Volume;
 VP = EMA( R, Period );
 TV = EMA( Volume, Period );
 return Nz( 100 * VP / TV );
}

Period = Param("Period", 14, 1, 100 );
Plot( VZO( Period ), "Volume Zone Osc" + _PARAM_VALUES(), colorBlack, styleThick );
Plot( 60, "", colorLightOrange, styleNoLabel );
Plot( 40, "", colorLightOrange, styleNoLabel  );
Plot( 0, "", colorBlack, styleNoLabel  );
Plot( -40, "", colorLime, styleNoLabel  );
Plot( -60, "", colorLime, styleNoLabel  );

TC2000: VOLUME ZONE OSCILLATOR
The volume zone oscillator (Vzo) in Walid Khalil and David Steckler’s article in this issue is now available in the TC2000 indicator library. To add the indicator to your chart, just click the “Add indicator” button and select it from the list.
In Figure 6, we’ve plotted a 60-period exponential moving average of price and the Adx with the period and smoothing set to 14. These additional indicators are used to evaluate the system rules explained in the article.
The oscillator zones on the Vzo are marked using plot guides on the Vzo indicator. To add/edit the plot guides on an indicator, click on the name of the indicator and select “Edit plot guides.” You can add and customize plot guides on any indicator in the system to mark significant levels. And once you’ve set up the plot guides the way you want them, click on the indicator and select Save. You now have your own customized version of the indicator available to you in the indicator library.
Using the “QuickSort/Add Column” feature, you can find stocks meeting the various Vzo system rules. As seen in Figure 6, we’ve added columns to find stocks passing the uptrend buy rules. Symbols Wfr and Qep are trading above their 60-day exponential average, Adx is above 18, and Vzo has just crossed up through -40. This all happens in real time.
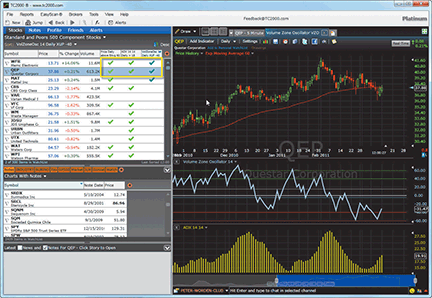
Figure 6: TC2000, volume zone oscillator. Here is a weekly chart of SPY with the 60-period exponential moving average of price, VZO with oscillator zones, and ADX. The watchlist also shows columns for price above the 60-day EMA, ADX above 18, and VZO crossing up through -40.
For more information on TC2000 or to start a free trial, visit www.TC2000.com. You can also access your watchlists, scans, and chart template while away from your computer using the new TC2000 Mobile app for Android 2.0 and higher (www.TC2000.com/Mobile).

NEUROSHELL TRADER: VOLUME ZONE OSCILLATOR
The volume zone oscillator (Vzo) described by Walid Khalil and David Steckler in their article in this issue can be easily implemented with a few of NeuroShell Trader’s 800+ indicators. Simply select “New Indicator…” from the Insert menu and use the Indicator Wizard to set up the following indicator:
Multiply2( 100, Divide( ExpAvg( Multiply2( NumPosNegMom(Close,1,1), Volume), 14), ExpAvg(Volume, 14) ) )
To create a volume zone oscillator trading system, select “New Trading Strategy …” from the Insert menu and enter the following in the appropriate locations of the Trading Strategy Wizard:
Generate a buy long market order if ALL of the following are true:
A>B(Close, ExpAvg(Close, 60) )
A>B(ADX(High, Low, Close, 14, 14), 18 )
OR2( CrossAbove(VZO, -40), CrossAbove(VZO,0) )

Generate a sell long market order if ONE of the following is true:
AND2( A>B(VZO, 60), A<B(Momentum(VZO,1), 0 )
CrossBelow(VZO, 40)
AND2( A<B(Close, ExpAvg(Close, 60), A<B(VZO, 0) )

Generate a sell short market order if ALL of the following are true:
A<B(Close, ExpAvg(Close, 60) )
A>B(ADX(High, Low, Close, 14, 14), 18 )
OR2( CrossBelow(VZO, 40), CrossBelow(VZO,0) )

Generate a cover short market order if ONE of the following is true:
AND2( A<B(VZO, -60), A>B(Momentum(VZO,1), 0 )
CrossAbove(VZO, -40)
AND2( A>B(Close, ExpAvg(Close, 60), A>B(VZO, 0) )
If you have NeuroShell Trader Professional, you can also choose whether the parameters should be optimized. After backtesting the trading strategy, use the “Detailed Analysis…” button to view the backtest and trade-by-trade statistics for the strategy.
Users of NeuroShell Trader can go to the Stocks & Commodities section of the NeuroShell Trader free technical support website to download a copy of this or any previous Traders’ Tips.
A sample chart is shown in Figure 7.
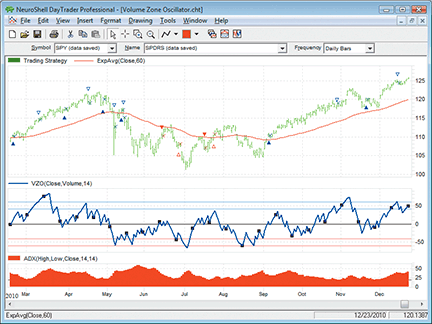
Figure 7: NEUROSHELL TRADER, volume zone oscillator. This NeuroShell Trader chart demonstrates the volume zone oscillator and corresponding trading system.

AIQ: VOLUME ZONE OSCILLATOR
The Aiq code for “In The Volume Zone” by Walid Khalil and David Steckler in this issue is shown here.
I have coded both the volume zone oscillator (Vzo) and the system that uses the Vzo indicator. I used my own interpretation of what the rules of their system mean since the exact code for the system is not given in the article. The divergence sell/cover rules were especially troublesome to interpret, so my version may not be what the authors intended. In addition, note that the nontrending case is not provided or tested.
I ran a backtest using the Portfolio Manager module from 1/1/1998 to 3/11/2011 using the Nasdaq 100 and also the Russell 1000 list of stocks. In Figure 8, I show the test results of simulated trading on the Nasdaq 100 list of stocks using the following parameters for capitalization:
- Maximum positions per day = 3
- Maximum total positions allowed = 10
- Choose candidates using ADX values in descending order
- Size each position at 10% of total account equity, recomputed daily.
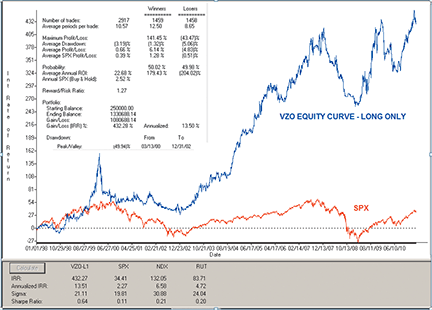
Figure 8: AIQ SYSTEMS, volume zone oscillator AND SYSTEM. This shows the equity curve for the VZO system trading long only using the NASDAQ 100 list of stocks compared to the SPX index for the test period 1/1/98 to 3/11/11.
For the test period, the average annual return was 13.5% with a maximum drawdown of 49.9% on 12/31/2002.
The short side test was unsuccessful, as the system lost all its capital during the early years of the test. (Results not shown.) I tried adding an index trend filter, but this did not save the short side from total loss.
The code and Eds file can be found at below or can be downloaded from www.TradersEdgeSystems.com/traderstips.htm.
AIQ code

! IN THE VOLUME ZONE
! Authors: Walid Khalil and David Steckler
! Coded by: Richard Denning 03/12/2011
! www.TradersEdgeSystems.com

! INPUTS:
vLen is  14. !INPUT IS USED FOR VZO
wLen is  14. !INPUT USED FOR DMI, ATR, ADX, ADX RATE
eLen is  60. !INPUT USED FOR EMA FOR TREND DETERMINATION
oLen is  21. !INPUT USED FOR LOOKBACK FOR VZO OVERBOT/OVERSOLD

!CODING ABREVIATIONS:
H is [high].
L is [low].
C is [close].
C1 is valresult(C,1).
H1 is valresult(H,1).
L1 is valresult(L,1).
V is [volume].

!VZO INDICATOR FORMULAS:
R is iff(C > C1,V,-V).
VP is expavg(R,vLen).
TV is expavg(V,vLen).
!PLOT VZO as custom indicator with +60 -60 support lines:
	VZO is (VP / TV) * 100.

!DMI & ADX indicators as defined by Wells Wilder.
! NOTE: Wilder to expontential averaging the formula is:
!	Wilder length * 2 -1 = exponential averaging length
avgLen is wLen * 2 - 1.

!AVERAGE TRUE RANGE:
TR  is Max(H-L,max(abs(C1-L),abs(C1-H))).
ATR  is expAvg(TR,avgLen).

!+DM -DM CODE:
rhigh is (H-H1).
rlow is (L1-L).
DMplus is iff(rhigh > 0 and rhigh > rlow, rhigh, 0).
DMminus is iff(rlow > 0 and rlow >= rhigh, rlow, 0).
AvgPlusDM is expAvg(DMplus,avgLen).
AvgMinusDM is expavg(DMminus,avgLen).
PlusDMI is (AvgPlusDM/ATR)*100.	!PLOT AS INDICATOR
MinusDMI is AvgMinusDM/ATR*100.	!PLOT AS INDICATOR

!ADX INDICATOR
DIdiff is PlusDMI-MinusDMI.
ZERO if PlusDMI = 0 and MinusDMI = 0.
DIsum is PlusDMI+MinusDMI.
DX is iff(ZERO,100,abs(DIdiff)/DIsum*100).
!PLOT ADX as single line indicator with support at 24 is same as ADX (AIQ):
	ADX is ExpAvg(DX,avgLen).

!TRADING SYSTEM RULES:
EMA is expavg(C,eLen).

UpTrend if ADX > 18 and C > EMA.
VZObuy1 if VZO > -40 and valrule(VZO < -40,1).
VZObuy2 if countof(VZO > 40,oLen) >=1 and VZO > 0 and valrule(VZO < 0,1).
Buy if UpTrend and (VZObuy1 or VZObuy2) and NOT Sell.

VZOsell1 if countof(VZO > 60,2,1) >= 1 and VZO < valresult(VZO,1).
VZOsell2 if slope2(C,vLen/2) > 0 and slope2(VZO,vLen/2) < 0 and VZO < 40.
VZOsell3 if C < EMA and VZO < 0.
Sell if VZOsell1 or VZOsell2 or VZOsell3.

DnTrend if ADX > 18 and C < EMA.
VZOshort1 if VZO < 40 and valrule(VZO > 40,1).
VZOshort2 if countof(VZO < -40,oLen) >=1 and VZO < 0 and valrule(VZO > 0,1).
Short if DnTrend and (VZOshort1 or VZOshort2) and NOT Cover.

VZOcover1 if countof(VZO < -60,2,1) >= 1 and VZO > valresult(VZO,1).
VZOcover2 if slope2(C,vLen/2) < 0 and slope2(VZO,vLen/2) > 0 and VZO > -40.
VZOcover3 if C > EMA and VZO > 0.
Cover if VZOcover1 or VZOcover2 or VZOcover3.

!PLOT DivergInd to see when the divergence is occuring:
	DivergInd is iff(VZOsell2,-100,   ! SELL EXIT DIVERGENCE = -100
    		iff(VZOcover2,100,0)).    ! COVER EXIT DIVERGENCE = 100

!REVISED ENTRY RULES WITH MARKET TREND FILTERS:
SPXema is TickerUDF("SPX",EMA).
NDXema is TickerUDF("NDX",EMA).
BuyMkt if Buy and SPXema > valresult(SPXema,10).
ShortMkt if Short and SPXema < valresult(SPXema,10).
BuyMktNDX if Buy and NDXema > valresult(NDXema,10).
ShortMktNDX if Short and NDXema < valresult(NDXema,10).

TRADERSSTUDIO: VOLUME ZONE OSCILLATOR
The TradersStudio code for the Vzo indicator based on Walid Khalil and David Steckler’s article in this issue, “In The Volume Zone,” is shown here.
' IN THE VOLUME ZONE
' Authors: Walid Khalil and David Steckler
' Coded by: Richard Denning 03/12/2011
' www.TradersEdgeSystems.com

Function VZO(vLen)
' Default:vLen = 14.
Dim R As BarArray
Dim VP As BarArray
Dim TV As BarArray
R = IFF(C > C[1],V,-V)
VP = XAverage(R,vLen)
TV = XAverage(V,vLen)
VZO = (VP / TV) * 100
End Function

'---------------------------------------------

'VZO INDICATOR:
Sub VZO_IND(vLen)
plot1(VZO(vLen))
plot2(60)
plot3(40)
plot4(0)
Plot5(-40)
Plot6(-60)
End Sub
Figure 9 shows the Vzo indicator on a chart of Adbe.
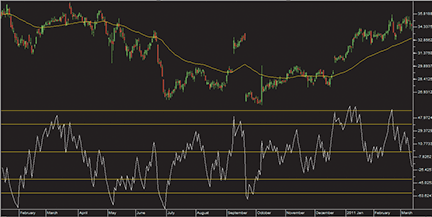
Figure 9: TRADERSSTUDIO, volume zone oscillator. Here is the VZO indicator on a TradersStudio chart of Adobe Systems (ADBE).
The code can be downloaded from the TradersStudio website at www.TradersStudio.com → Traders Resources → FreeCode or www.TradersEdgeSystems.com/traderstips.htm.

STRATASEARCH: VOLUME ZONE OSCILLATOR
Using volume as a confirmation for price action is an excellent idea, and the volume zone oscillator (Vzo), as presented in Walid Khalil and David Steckler’s article in this issue, shows some great potential despite its simplicity. In fact, we were able to assemble a very nice system using the volume zone oscillator as the foundation.
Using the uptrend system rules provided by the authors, however, we had only limited success. Testing a wide variety of parameter sets, we were able to find profitable systems that beat their benchmark, but the percentage of profitable trades was quite low, there were large numbers of consecutive losses, and profit often came primarily from outlier trades.
In a separate test, we then placed the Vzo in an automated search for supporting trading rules. This can be done in StrataSearch by setting the Vzo as a primary trading rule, and automatically testing it alongside thousands of preprogrammed supporting rules. The results from this automated search were much more positive, with higher annual returns, percentage of profitable trades approaching 70%, and very few outlier trades. In short, the Vzo can be a very nice indicator, but as with many indicators, it works best when used alongside the proper supporting rules.
StrataSearch users can download and import a plugin for the volume zone oscillator from the Shared Area of the StrataSearch user forum. The plugin contains a chart, a strategy setup, and all the settings needed to run the Vzo in an automated search for supporting trading rules.
A sample chart is shown in Figure 10.
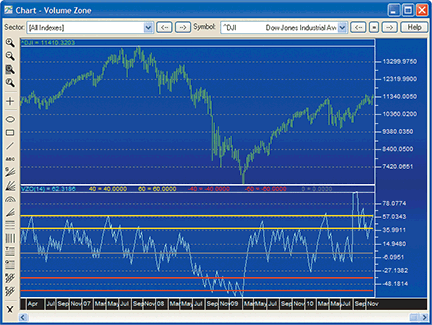
Figure 10: STRATASEARCH, volume zone oscillator. The volume zone oscillator can be seen in the bottom panel of this chart displaying weekly bars of the Dow Jones Industrial Average.
//*********************************************************
// Volume Zone Oscillator
//*********************************************************
Period = parameter("Period");

MV = volume;
R = sign(close - ref(close, -1)) * MV;
VP = mov(R, Period, exponential);
TV = mov(MV, Period, exponential);

VZO = 100 * VP / TV;

TRADINGSOLUTIONS: VOLUME ZONE OSCILLATOR
In the article “In The Volume Zone” in this issue, Walid Khalil and David Steckler present an oscillating indicator based on volume and price direction.
The TradingSolutions function is provided below and is also available as a function file that can be downloaded from the TradingSolutions website (www.tradingsolutions.com) in the Free Systems section.
Function Name: Volume Zone Oscillator
Short Name: VZO
Inputs: Close, Volume, Period

Mult (100, Div (EMA (If (Inc (Close), Volume, Negate (Volume)), Period), EMA (Volume, Period)))

TRADECISION: VOLUME ZONE OSCILLATOR
The article by Walid Khalil and David Steckler in this issue, “In The Volume Zone,” demonstrates the volume zone oscillator (Vzo), which can be applied to trending and nontrending markets such as Dia, Spy, and gold.
To recreate Khalil and Steckler’s Vzo indicator in Tradecision, use Tradecision’s Indicator Builder to input the following code:
VZO indicator
input
Period:"Enter the Period:", 14, 2, 100;
end_input

var
R:=0;
VP:=0;
TV:=0;
VZO:=0;
end_var

R:=iff(C >Ref(C, -1), V, -V);
VP:=Mov(R, Period, E);
TV:=Mov(V, Period, E);
VZO:=100 * (VP / TV);

return VZO;
To import this strategy into Tradecision, visit the area “Traders’ Tips from Tasc Magazine” at www.tradecision.com/support/tasc_tips/tasc_traders_tips.htm or copy the code above.
A sample chart is shown in Figure 11.
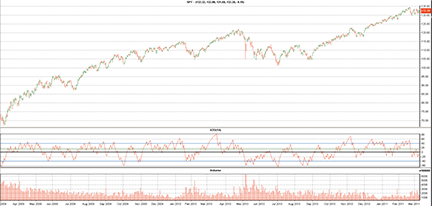
FIGURE 11: TRADECISION, volume zone oscillator. Here is the VZO plotted on a chart of the SPY.

NINJATRADER: VOLUME ZONE OSCILLATOR
The volume zone oscillator (Vzo), as presented by Walid Khalil and David Steckler in their article “In The Volume Zone” in this issue, has now been implemented as an indicator for NinjaTrader. The indicator is available for download at www.ninjatrader.com/SC/May2011SC.zip.
Once you have it downloaded, from within the NinjaTrader Control Center window, select the menu File → Utilities → Import NinjaScript and select the downloaded file. This indicator is for NinjaTrader version 7 or greater.
You can review the indicator source code by selecting the menu Tools → Edit NinjaScript → Indicator from within the NinjaTrader Control Center window and selecting “VolumeZoneOscillator.”
NinjaScript uses compiled Dlls that run native, not interpreted, which provides you with the highest performance possible.
A sample chart implementing the strategy is shown in Figure 12.
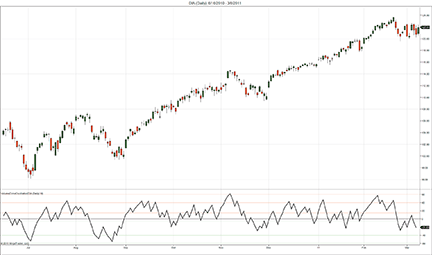
Figure 12: NINJATRADER, volume zone oscillator. This NinjaTrader chart shows the VolumeZonesOscillator applied to a daily chart of the SPDR Dow Jones Industrial Average ETF (DIA).

UPDATA: VOLUME ZONE OSCILLATOR
This tip is based on “In The Volume Zone” by Walid Khalil and David Steckler in this issue.
In their article, the authors present an indicator that takes into account both time and volume fluctuations for predicting future price direction, of equal application to trending or oscillating market phases.
We have added the Updata code for this indicator to the Updata Indicator Library. It may be downloaded by clicking the Custom menu and then “Indicator library.” Those who cannot access the library due to a firewall may paste the following code into the Updata Custom editor and save it.
PARAMETER "Exp. Averaging Period" #ExpAvgPeriod=14
NAME "VZO (" #ExpAvgPeriod ")" ""
DISPLAYSTYLE Line
PLOTSTYLE Thick2 RGB(0,0,0)
INDICATORTYPE Chart

@R=0
@VolumePosition=0
@TotalVolume=0
@VolumeZoneOsc=0

FOR #CURDATE=#ExpAvgPeriod TO #LASTDATE

   @R=Sign(Close-Close(1))*Vol
   @VolumePosition=Sgnl(@R,#ExpAvgPeriod,E)
   @TotalVolume=Sgnl(Vol,#ExpAvgPeriod,E)
   @VolumeZoneOsc=100*(@VolumePosition/@TotalVolume)

   @PLOT=@VolumeZoneOsc

   'Draw Oscillator Zones
   DRAWLEVEL LINE,0,RGB(100,100,100)
   DRAWLEVEL LINE,15,RGB(255,0,0)
   DRAWLEVEL LINE,-5,RGB(255,0,0)
   DRAWLEVEL LINE,40,RGB(0,0,255)
   DRAWLEVEL LINE,-40,RGB(0,0,255)
   DRAWLEVEL LINE,60,RGB(0,255,0)
   DRAWLEVEL LINE,-60,RGB(0,255,0)

NEXT
A sample chart is shown in Figure 13.
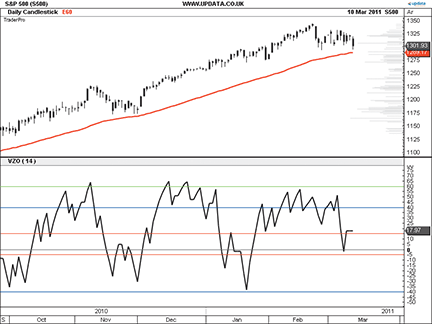
FIGURE 13: UPDATA, volume zone oscillator. This chart shows the 14-period VZO applied to the S&P 500 index. If the VZO breaks below zero while price falls below its 60-period EMA, it signals closing out long positions established during this uptrend.

FOR WINDOWS
+ MAC + LINUX
CHARTSY: VOLUME ZONE OSCILLATOR
The indicator presented in “In The Volume Zone” by Walid Khalil and David Steckler in this issue is available for Chartsy version 1.4 or higher as the “volume zone oscillator” plugin. To install this plugin, go to Tools → Plugins → Available Plugins.
You can find the Java source code for the volume zone oscillator (Vzo) here.
A sample chart is shown in Figure 14. The properties window for the Vzo is shown in Figure 15.
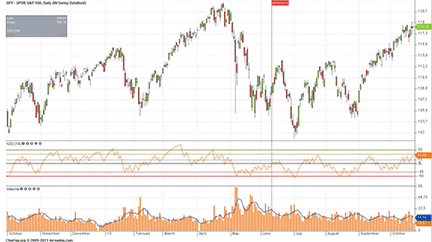
FIGURE 14: CHARTSY, volume zone oscillator. Here is a sample chart of the volume zone oscillator (VZO).
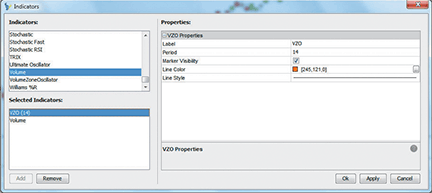
FIGURE 15: CHARTSY, PROPERTIES WINDOW. Here, the indicator properties window is shown for the volume zone oscillator.
To download Chartsy, discuss these tools, and help us develop other tools, please visit our forum at www.chartsy.org. Our development staff will be happy to assist and you can become a Chartsy contributor yourself.

SHARESCOPE: VOLUME ZONE OSCILLATOR
Here is a ShareScope script to implement the volume zone oscillator (Vzo) based on Walid Khalil and David Steckler’s article in this issue, “In The Volume Zone.”
//@Name:VZO
//@Description:Volume Zone Oscillator. As described in Stocks & Commodities magazine, May 2011 issue.

var period = 14;
function init()
{
	setSeriesColour(0, Colour.Red);
	setTitle(period+" VZO");
	setHorizontalLine(60);
	setHorizontalLine(40);
	setHorizontalLine(0);
	setHorizontalLine(-40);
	setHorizontalLine(-60);
}
function getGraph(share, data)
{
	var VZO = [];
	var ma1 = new MA(period, MA.Exponential);
	var ma2 = new MA(period, MA.Exponential);
	for (var i=1; i<data.length; i++)
	{
		var ema1 = ma1.getNext((data[i].close>data[i-1].close?1:-1)*data[i].volume);
		var ema2 = ma2.getNext(data[i].volume);
		VZO[i] = ema2!=0?(100*ema1/ema2):0;
	}
	return VZO;
}
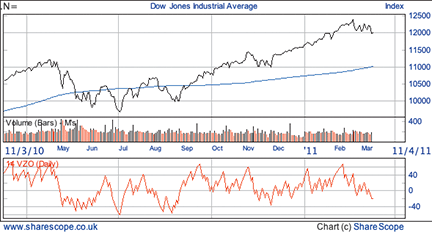
Figure 16: SHARESCOPE, volume zone oscillator

GENESIS: VOLUME ZONE OSCILLATOR
Trade Navigator offers everything needed for recreating the indicators and highlights discussed in Walid Khalil and David Steckler’s article in this issue, “In The Volume Zone.”
Detailed instructions and code to recreate the custom indicator and add it to any chart in Trade Navigator are shown here. We also show you how to use the custom indicator alongside existing indicators in Trade Navigator to set up a template that can be easily applied to any chart.
Here is the TradeSense code to create the custom indicator. Input this code by opening the Trader’s Toolbox, then click on the Functions tab, and click the New button.
Volume zone oscillator
&R := IFF (Close > Close.1 , Volume , Volume * -1)
&VP := MovingAvgX (&R , 14 , False)
&TV := MovingAvgX (Volume , 14 , False)
&VZO := 100 * (&VP / &TV)
&VZO
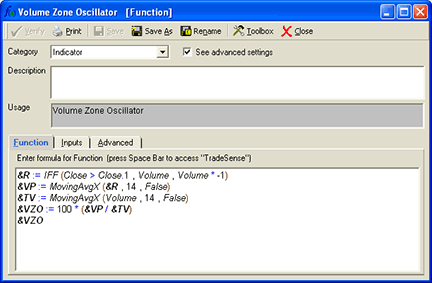
Figure 17: Trade Navigator function tab.
To create a chart template, go to the “Add to chart” window on a daily chart by clicking on the chart and typing “A” on the keyboard. Click on the Indicators tab, find the volume zone oscillator in the list, and either double-click on it or highlight the name and click the Add button.
Repeat these steps to add the Adx and the MovingAvgX indicator. (These are just two of the many indicators provided in Trade Navigator.) On the chart, click on the MovingAvgX label and drag it into the price pane.
Hold down the Crtl key and click in the pane with the volume zone oscillator to make seven horizontal lines. Click once for each line at the -60, -40, -5, 0, 15, 40, & 60 values in that pane. They do not have to be exact because you can either drag the line to the correct position later or set it in the Chart Settings window.
Click on the chart and type the letter E to bring up the chart settings window. Click on the MovingAvgX in the list under price. Change the values as follows: Expression: close, Bars used in average: 60, and Show initial bars: false.
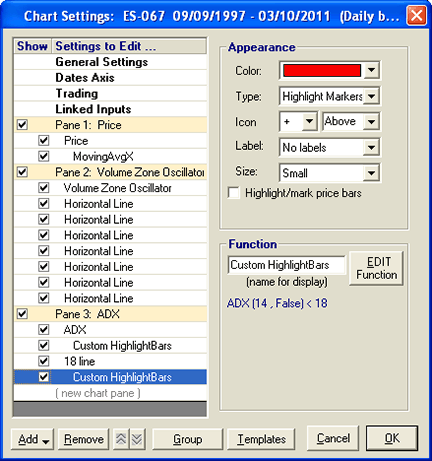
Figure 18: chart settings tab
Click on the pane 3: Adx line to highlight it. Then click the Add button at the bottom. Select Add Indicator → Add Indicator to Selected Pane. With “custom indicator” highlighted, click the Add button. Type “18” and click the OK button. Click in the Function name box and change it from custom indicator to 18 line.
Next, click on the Adx to highlight it in the list on the left. Set “Bars used in calculation” to 14. Click the Add button and select “Add HighlightBars to selected indicator.” With “Custom HighlightBars” highlighted, click the Add button. Click the No button when prompted to use indicators from the active chart. Type ADX (14, False)>18 and click the OK button.
Setting up the template
Click on 18 line to highlight it in the list on the left. Click the Add button and select “Add HighlightBars to selected indicator.” With “Custom HighlightBars” highlighted, click the Add button. Click the No button when prompted to use indicators from the active chart. Type ADX (14, False)<18 and click the OK button. Under Appearance, change the type to “highlight markers” and the icon to “+.”
Highlight each indicator, line, or highlight bar and change it to the desired color, value, and style in the chart settings window. When you have them the way you want to see them, click on the OK button.
Click on the Templates button on the toolbar at the top. Select “Manage chart templates.” Click the New button, type a name for the template, and click the OK button.
You now have a template that you can apply to any chart by going to the Templates button in the toolbar and selecting the template from the list.
Genesis Financial Technologies has provided a library called “In the Volume Zone,” which includes the template “SC1105 In the Volume Zone” with the custom indicators discussed in this article. You can download a special file named “SC1105,” downloadable through Trade Navigator.
MICROSOFT EXCEL: VOLUME ZONE OSCILLATOR
The volume zone oscillator (Vzo) proposed by Walid Khalil and David Steckler in their article in this issue, “In The Volume Zone,” helps to visualize the activity of the big financial leaders and the subsequent activity of the financial followers. No matter how slowly or carefully an elephant enters a pool, the water will rise. And it will subsequently fall when he leaves the pool.
The sharp Vzo increase in April 2010 might well reflect one or more of these larger entities moving into Gld. The decline through early May 2010 could well be these same players leaving the pool before the price dropoff in mid-May.
Without an Excel-accessible price history database to scan, this month’s Traders’ Tip for Excel is a static solution. As the Excel user, you must capture historical price data for a given stock or other tradable that you wish to study, and place it in the “InputPriceData” tab.
To complete the Data Windowing capability introduced last month in Traders’ Tips, I have added a usability feature to the Excel template I use for Traders’ Tips. A button now appears on the calculations tab which will automatically:
- Adjust the charts to reflect a user-chosen number of points to plot;
- Set the vertical scales (y-axis) on the price chart to get the “best” use of the available vertical plot space; and
- Vertically align the three charts; in particular, it will vertically align the x-axis of all three charts.
For this button to work properly, you will need to enable Vba macro content. You may view the macros after you open the spreadsheet by using Alt-F11 to open the Vba integrated development environment.
Click here “VolumeZoneOscillator.xls” to download the volume zone oscillator spreadsheet.
A sample chart output from Excel is shown in Figure 19.
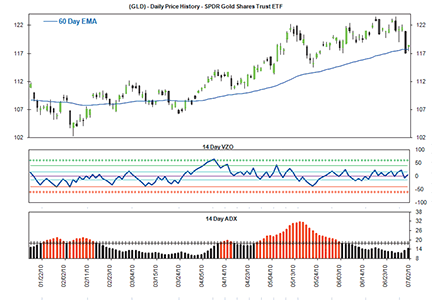
Figure 19: MICROSOFT EXCEL, volume zone oscillator. Here is the volume zone oscillator (VZO) on a chart output from Excel.

VT TRADER: JM INTERNAL BAND TRADING STRATEGY
This Traders’ Tip is based on “Less Stress With The JM Internal Band” by Koos van der Merwe, which appeared in the December 2010 issue of S&C.
In the article, the author describes a trading system using a 15-period simple moving average with bands above and below at +/-2% respectively for identifying potential trading opportunities. A long trade is initiated when the price breaks out above the upper band, and a short trade is initiated when price breaks out below the lower band. Exits are initiated when price crosses the moving average in the opposite direction of the band breakout.
The VT Trader instructions for setting up the JM internal band trading system are shown below. The system is available for download in our VT client forums at https://forum.vtsystems.com, along with many other precoded and free trading systems.
- Ribbon>Technical Analysis menu→Trading Systems group→Trading Systems Builder command→[New] button
- In the General tab, type the following text for each field:
Name: TASC - 05/2011 - JM Internal Band Strategy
Function Name Alias: tasc_JmBandStrategy
Label Mask: TASC - 05/2011 - JM Internal Band Strategy
- In the Input Variable(s) tab, create the following variables:
[New] button...
Name: Pr
Display Name: MA Price
Type: price
Default: Close

[New] button...
Name: tPr
Display Name: MA Periods
Type: integer
Default: 15

[New] button...
Name: mt
Display Name: MA Type
Type: MA type
Default: Simple

[New] button...
Name: prcnt
Display Name: JM Band %
Type: float
Default: 0.2
- In the Output Variable(s) tab, create the following variables:
	[New] button...
Var Name: UB
Name: JM Upper Band
* Checkmark: Indicator Output
Select Indicator Output Tab
Line Color: blue
Line Width: 1
Ling Style: solid
Placement: Price Frame
[OK] button...

[New] button...
Var Name: MA
Name: Moving Average
* Checkmark: Indicator Output
Select Indicator Output Tab
Line Color: blue
Line Width: 1
Ling Style: dashed
Placement: Price Frame
[OK] button...

[New] button...
Var Name: LB
Name: JM Lower Band
* Checkmark: Indicator Output
Select Indicator Output Tab
Line Color: blue
Line Width: 1
Ling Style: solid
Placement: Price Frame
[OK] button...

[New] button...
Var Name: LongSignal
Name: Long Signal
* Checkmark: Graphic Enabled
* Checkmark: Alerts Enabled
Select Graphic Tab
Font [...]: Up Arrow
Size: Medium
Color: Blue
Symbol Position: Below price plot
	Select Alerts Tab
		Alert Message: Long Signal
		Alert Sound: others.wav
[OK] button...

[New] button...
Var Name: LongExitSignal
Name: Long Exit Signal
* Checkmark: Graphic Enabled
* Checkmark: Alerts Enabled
Select Graphic Tab
Font [...]: Exit Sign
Size: Medium
Color: Blue
Symbol Position: Above price plot
	Select Alerts Tab
		Alert Message: Long Exit Signal
		Alert Sound: others.wav
[OK] button...

[New] button...
Var Name: ShortSignal
Name: Short Signal
* Checkmark: Graphic Enabled
* Checkmark: Alerts Enabled
Select Graphic Tab
Font [...]: Down Arrow
Size: Medium
Color: Red
Symbol Position: Above price plot
	Select Alerts Tab
		Alert Message: Short Signal
		Alert Sound: others.wav
[OK] button...

[New] button...
Var Name: ShortExitSignal
Name: Short Exit Signal
* Checkmark: Graphic Enabled
* Checkmark: Alerts Enabled
Select Graphic Tab
Font [...]: Exit Sign
Size: MEdium
Color: Red
Symbol Position: Below price plot
	Select Alerts Tab
		Alert Message: Short Exit Signal
		Alert Sound: others.wav
[OK] button...

[New] button...
Var Name: OpenBuy
Name: Open Buy
* Checkmark: Trading Enabled
Select Trading Tab
Trading Action: BUY
[OK] button...

[New] button...
Var Name: CloseBuy
Name: Close Buy
* Checkmark: Trading Enabled
Select Trading Tab
Trading Action: SELL
[OK] button...

[New] button...
Var Name: OpenSell
Name: Open Sell
* Checkmark: Trading Enabled
Select Trading Tab
Trading Action: SELL
[OK] button...

[New] button...
Var Name: CloseSell
Name: Close Sell
* Checkmark: Trading Enabled
Select Trading Tab
Trading Action: BUY
[OK] button...
- In the Formula tab, copy and paste the following formula:
{JM Bands} MA:= Mov(Pr,tPr,mt); UB:= MA+(MA*(prcnt/100)); LB:= MA-(MA*(prcnt/100)); {Generate Potential Trading Signals} LongSignal:= Cross(SignalFlag(Cross(C,UB),Cross(MA,C)),0.5); LongExitSignal:= Cross(0.5,SignalFlag(Cross(C,UB),Cross(MA,C))); ShortSignal:= Cross(SignalFlag(Cross(LB,C),Cross(C,MA)),0.5); ShortExitSignal:= Cross(0.5,SignalFlag(Cross(LB,C),Cross(C,MA))); {Auto-Trading Functionality; Used in Auto-Trade Mode Only} OpenBuy:= BuyPositionCount()=0 AND LongSignal=1; CloseBuy:= BuyPositionCount()>0 AND LongExitSignal=1; OpenSell:= SellPositionCount()=0 AND ShortSignal=1; CloseSell:= SellPositionCount()>0 AND ShortExitSignal=1; - Click the “Save” icon to finish building the trading system.
To attach the trading system to a chart, select the “Add Trading System” option from the chart’s contextual menu, select “TASC - 05/2011 - JM Internal Band Strategy” from the trading systems list, and click the [Add] button.
To learn more about VT Trader, visit www.vtsystems.com. A sample chart is shown in Figure 20.
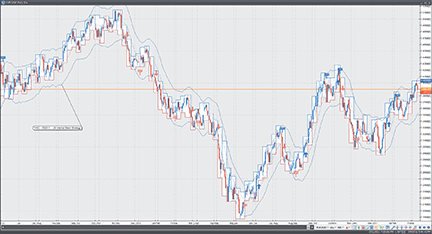
Figure 20: VT TRADER, JM INTERNAL BAND TRADING SYSTEM. This shows the JM internal band trading system on a EUR/USD daily candlestick chart.
Risk disclaimer: Forex trading involves a substantial risk of loss and may not be suitable for all investors.

VOLUME ZONE OSCILLATOR — KHALIL & STECKLER ARTICLE
CODE
With appreciation to Aapta member Bob Fulks for assistance with the TradeStation coding.
TradeStation
Volume zone oscillator:

Input: Period(14);
Vars: MV(0), R(0), VP(0), TV(0), VZO(0);

MV = iff(DataCompression >= 2, AbsValue(Volume),Ticks);
R = Sign(Close - Close[1]) * MV;
VP = XAverage(R, Period);
TV = Xaverage(MV, Period);

if TV <> 0 then VZO = 100 * VP / TV;

Plot1(VZO, "VZO");
Plot2(+60, "+60");
Plot3(+40, "+40");
Plot4(+15, "+15");
Plot5(-5, "-5");
Plot6(-40, "-40");
Plot7(-60, "-60");
Plot99(0, "zero");

MetaStock
Volume zone oscillator:

Period := Input("Y" ,2 ,200 ,14 );
R :=If(C>Ref(C,-1),V,-V);
VP :=Mov(R,Period ,E);
TV :=Mov(V,Period ,E);
VZO :=100*(VP/TV);
VZO