INDICATORS
The Quest Continues
Comparing Seven Money Flow Indicators
An overabundance of money flow indicators can clutter your desktop and could confuse you with contradicting signals. But do these indicators have any predictive value? If so, which is best?
Since Joseph Granville presented the first money flow indicator in 1963, other technicians have attempted to improve on Granville’s original formula or devise a completely new approach using volume to predict market price moves. On-balance volume (Obv), Chaikin money flow (Cmf), accumulation/distribution, volume price trend (Vpt), volume oscillator (VO), ease of movement, negative volume index, positive volume index, Klinger oscillator, volume flow indicator (Vfi), and the money flow index (Mfi) are all indicators that technicians have developed to quantify the relationship between price and volume.
Yes, there are many. Bearing in mind that besides the stock chart and other price-based indicators there is only room on a 19-inch monitor for one or two volume indicators, you will have to choose from more than 15 money flow indicators for your standard layouts. An even more critical decision would be choosing a volume indicator for your trading system, given that two different indicators can produce contradicting signals.
Which ones work the best? To find out, I tested seven popular money flow indicators using two objective mechanical systems and a visual method. But first, here’s some background information on these indicators.
The basics
Volume or money flow indicators can be divided into five categories:
- Those using volume based on the interday change in price from one day to the next. The best-known indicator in this category is Granville’s Obv. Later variations include Markstein’s volume price trend (Vpt) and the volume flow indicator (Vfi), which I introduced in my June 2004 Stocks & Commodities article (see “Suggested reading” at the end of this article).
- Those focusing on the change in prices on an intraday basis (such as the Cmf and the intraday intensity).
- Those showing the periodic volume change without reference to price (such as the volume oscillator [VO]).
- Those using volume to improve on existing indicators (such as the volume-weighted moving average convergence/divergence [Macd] or the volume-weighted moving average).
- Those using both inter- and intraday price changes. The only indicator in this category is the finite volume elements (Fve). Details about this indicator can be found in my April and September 2003 articles.

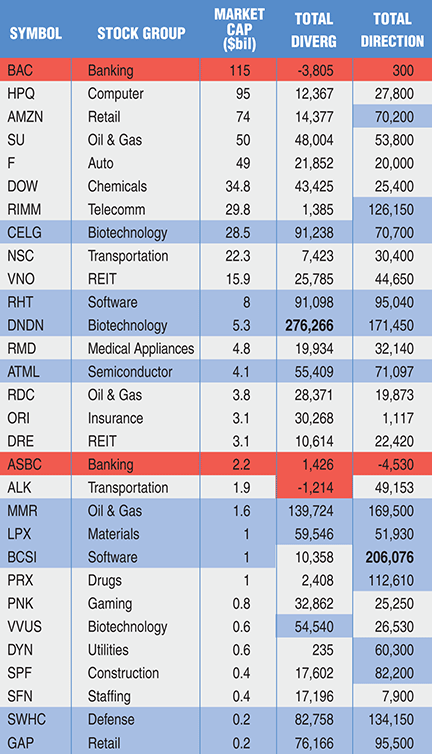
Figure 1: Combined total profits of both systems on a stock-by-stock basis for the divergence (fourth column) and the direction test (fifth column). The stocks are sorted by capitalization and colored according to profitability. The best performers were small- and mid-cap stocks and the worst performers were the financials.