TRADERS’ TIPS
August 2011
Here is this month’s selection of Traders’ Tips, contributed by various developers of technical analysis software to help readers more easily implement some of the strategies presented in this and other issues.
Other code appearing in articles in this issue is posted in the Subscriber Area of our website at https://technical.traders.com/sub/sublogin.asp. Login requires your last name and subscription number (from mailing label). Once logged in, scroll down to beneath the “Optimized trading systems” area until you see “Code from articles.” From there, code can be copied and pasted into the appropriate technical analysis program so that no retyping of code is required for subscribers.
You can copy these formulas and programs for easy use in your spreadsheet or analysis software. Simply “select” the desired text by highlighting as you would in any word processing program, then use your standard key command for copy or choose “copy” from the browser menu. The copied text can then be “pasted” into any open spreadsheet or other software by selecting an insertion point and executing a paste command. By toggling back and forth between an application window and the open web page, data can be transferred with ease.
This month’s tips include formulas and programs for:
- TRADESTATION: FIBONACCI/LUCAS TIME SERIES INDICATOR
- BLOOMBERG: FIBONACCI/LUCAS TIME SERIES INDICATOR
- THINKORSWIM.COM: FIBONACCI/LUCAS TIME SERIES INDICATOR
- eSIGNAL: FIBONACCI/LUCAS TIME SERIES INDICATOR
- WEALTH-LAB: FIBONACCI/LUCAS TIME SERIES INDICATOR
- AMIBROKER: FIBONACCI/LUCAS TIME SERIES INDICATOR
- NEUROSHELL TRADER: FIBONACCI/LUCAS TIME SERIES INDICATORS
- AIQ: THREE BLACK CROWS PATTERN
- TRADERSSTUDIO: FIBONACCI/LUCAS TIME SERIES INDICATOR
- TRADECISION: FIBONACCI/LUCAS TIME SERIES INDICATOR
- NINJATRADER: FIBONACCI/LUCAS TIME SERIES INDICATOR
- TRADE NAVIGATOR: FIBONACCI/LUCAS TIME SERIES INDICATOR
- UPDATA: FIBONACCI/LUCAS TIME SERIES INDICATOR
- MICROSOFT EXCEL: FIBONACCI/LUCAS TIME SERIES INDICATORS
- TRADESIGNAL: FIBONACCI/LUCAS TIME SERIES INDICATOR
- VT TRADER: FIBONACCI/LUCAS TIME SERIES INDICATOR
- FIBONACCI/LUCAS TIME SERIES INDICATOR — COLES ARTICLE CODE

TRADESTATION: FIBONACCI/LUCAS TIME SERIES INDICATOR
In “Automated Techniques For Intraday Traders” in this issue, author Andrew Coles suggests the use of Fibonacci numbers and Lucas numbers to anticipate potential market reaction points. The concept is to identify bars that are a Fibonacci or Lucas number of bars from a key bar on the chart, then use this and other information to determine potential market reaction.
Here, we present indicator code that will identify bars that are a Fibonacci or Lucas number of bars from a given “start bar.” Once the start bar is found by the code, a counter starts. If the counter matches one of the Fibonacci or Lucas numbers discussed in the article, the bar is identified with a PaintBar or ShowMe marker as set by the inputs. Multiple insertions of the indicator with different colors, plot styles (PaintBar or ShowMe), and offsets can be used to identify confluence of different insertions.
The EasyLanguage code is shown here. To download the code for the indicator and strategy, first navigate to the EasyLanguage Faqs and reference posts topic in the EasyLanguage support forum (https://www.tradestation.com/Discussions/Topic.aspx?Topic_ID=47452), scroll down and click on the link labeled “Traders’ Tips, Tasc.” Then select the appropriate link for the month and year. The Eld filename is “_FibAndLucasSeries_Tasc.Eld.”
EasyLanguage code for Fibonacci/Lucas time series indicator
_FibAndLucasSeries (Indicator)

{ TASC Article "Automated Techniques For Intraday Traders" - August 2011 }

inputs:
	ELStartDate( 1110501 ), { Bar Date for start bar in EasyLanguage format }
	ELStartTime( 1200 ), { Bar Time for start bar }
	FibBarColor( Red ),
	LucasBarColor( Cyan ),
	PlotAsPaintBar_0_or_ShowMe_1( 0 ), { to plot as a PaintBar, enter 0 or to plot
	 as a ShowMe, enter 1 }
	ShowMeDotOffsetTicks( 10 ) ; { enter offset for dot if plotting as ShowMe }

variables:
	MyTick( MinMove/PriceScale ),
	OkToCount( false ),
	OkToPlot( false ),
	PlotColor( 0 ),
	BarCounter( 0 ) ;

if OkToCount then
	BarCounter = BarCounter + 1 ;

if Date = ELStartDate and Time = ELStartTime then
	OkToCount = true ;

switch ( BarCounter )
	begin

	{ Fib Series }
	Case 5,8,13,21,34,55,89,144,233,377,610,987,1597,2584,4181,6785 :
		OkToPlot = true ;
		PlotColor = FibBarColor ;

	{ Lucas Series }
	Case 3,4,7,11,18,29,47,76,123,199,322,521,843,1364,2207,3571 :
		OkToPlot = true ;
		PlotColor = LucasBarColor ;

	end ;

if OkToPlot then
	begin
	if PlotAsPaintBar_0_or_ShowMe_1 = 0 then
		begin
		Plot1( H ) ;
		Plot2( L ) ;
		Plot3( O ) ;
		Plot4( C ) ;
		end
	else
		Plot5( L - MyTick * ShowMeDotOffsetTicks ) ;

	SetPlotColor( 1, PlotColor ) ;
	SetPlotColor( 2, PlotColor ) ;
	SetPlotColor( 3, PlotColor ) ;
	SetPlotColor( 4, PlotColor ) ;
	SetPlotColor( 5, PlotColor ) ;

	end ;

OkToPlot = false ;
A sample chart is shown in Figure 1.
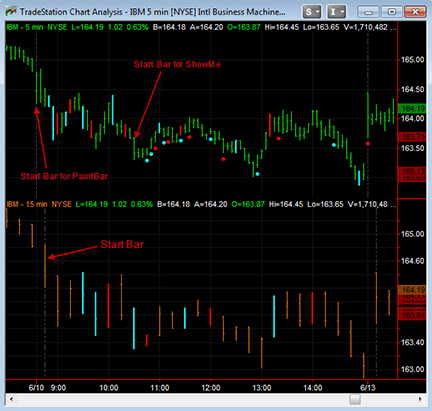
Figure 1: TRADESTATION, FIBONACCI AND LUCAS TIME SERIES INDICATOR. Here is a sample multidata chart of IBM showing a five-minute chart in the top graph and a 15-minute chart in the bottom graph. The FibAndLucasSeries indicator was applied twice to the five-minute chart (see start bars on the chart). The second insertion was plotted as a ShowMe to allow for visual recognition of confluence of the PaintBar and ShowMe markers. The bottom chart is a higher time frame chart with the indicator applied so that multiple time frames can be analyzed.
This article is for informational purposes. No type of trading or investment recommendation, advice, or strategy is being made, given, or in any manner provided by TradeStation Securities or its affiliates.

BLOOMBERG: FIBONACCI/LUCAS TIME SERIES INDICATOR
The five-minute chart in Figure 2 shows a three-day trading period of 10-year Treasury note futures (TY). “Needle-like projections” are displayed on the charts in Andrew Coles’ article in this issue (“Automated Techniques For Intraday Traders”) in order to note the bars corresponding to significant numerical sequences. Coles’ article discusses two such sequences, Fibonacci and Lucas; our chart exhibits just the Fibonacci bar count.
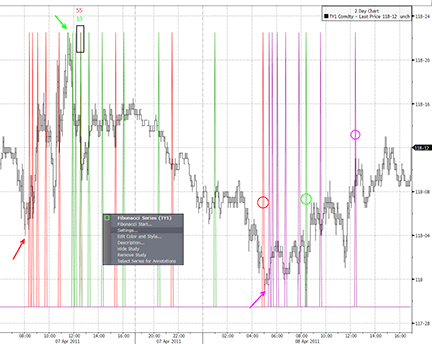
Figure 2: BLOOMBERG, FIBONACCI AND LUCAS TIME SERIES INDICATOR. This five-minute chart shows the active futures continuous contract for 10-year Treasury notes over a three-day period in April 2011. Significant high and low swing points are used as starting points for the Fibonacci sequence of numbers. The counts following these swings often reveal other significant bars later in the chart.
The Bloomberg Custom Study platform includes functionality that allows the user to click on the chart to establish the starting bar for the study, rather than needing to manually input the date and time. However, this causes the study to initially display a count from the first bar on the chart. A right-click on the indicator will pop up a properties dialogue box as shown in Figure 2. In this case, users can click on the setting we’ve named “Fibonacci start” to establish a new beginning bar.
In addition, we have chosen to use Paint Bars to denote these beginning bars. The red, green, and purple arrows point to these beginning bars. In overlaying the three Fibonacci sequences beginning at important swing highs and lows, we can indeed see the significant occurrences mentioned by Coles. A major low is made within one bar of the point where the initial red count and the following green count overlap on the same bar, as shown by the black box with “55” and “13” in Figure 2, these being the counts of each color. Other noteworthy swing bars are also shown coinciding within one bar of the Fibonacci counts, as indicated by the corresponding circles on the needle projections.
Using the CS.Net framework within the Stdy<GO> function on the Bloomberg Terminal, C# or Visual Basic code can be used to display the Fibonacci and Lucas sequences described here. The C# code for this indicator is shown here.
Bloomberg code for Fibonacci/Lucas time series indicator

using System;
using System.Collections.Generic;
using System.Text;
using System.Drawing;
using Bloomberg.Study.API;
using Bloomberg.Study.CoreAPI;
using Bloomberg.Study.Util;
using Bloomberg.Study.TA;
using Bloomberg.Math;

namespace Lucas_Series
{

    public partial class LucasSeries
    {
        // DateTime to hold the starting point for the sequence
        DateTime startPoint;

        private void Initialize()
        {
            //Create Lines to Output at Lucas Counts
            Output.Add("Lucas", new TimeSeries());
            StudyLine LucasLine = new StudyLine("Lucas", Color.Red);
            LucasLine.Style = LineStyle.Solid;
            LucasLine.Width = 1;
            ParentPanel.Visuals.Add("LucasCount", LucasLine);

            //Create Paint Bar mark start point of Lucas Count
            Output.Add("PaintBar", new TimeSeries());
            StudySignal paintBar = new StudySignal("PaintBar");
            paintBar.Marker = new PaintBar(Color.Cyan);
            ParentPanel.Visuals.Add("PaintBar", paintBar);

            // Register callback function for handling chart click to set a new start point
            Notifications.Add("Lucas Start", new StudyIndexNotification(lucStartCallback));
        }


        public override void Calculate()
        {
            // Find the min and max value of the chart data for plotting the needle projections
            double minValue = Input.Low.Minimum;
            double maxValue = Input.High.Maximum;

            int count = Input.Close.Count;
            TimeSeries paintBarData = new TimeSeries(count);
            TimeSeries lucasData = new TimeSeries(count, minValue);

            // This section will tie the color of the Paint Bar (clicked bar) to the color of the Lucas Lines
            StudyLine line = ParentPanel.Visuals["LucasCount"] as StudyLine;
            StudySignal signal = ParentPanel.Visuals["PaintBar"] as StudySignal;
            PaintBar paintBar = signal.Marker as PaintBar;
            paintBar.Color = line.Color;
            line.ShowValues(false);  // This stops the needle projections from showing a value in the legend


            // Intialize the start point to the beginning of the chart
            if (startPoint == null)
            {
                startPoint = Input.DateTimes[0];
            }

            // Find the starting point of the sequence based on the selected DateTime
            int startIndex = 0;
            while (startIndex < Input.Close.Count && Input.DateTimes[startIndex] < startPoint)
            {
                startIndex++;
            }

            // Mark the starting point with a paintBar
            paintBarData[startIndex] = 1;

            // Instead of manually inserting each Fibonacci count value, the study will compute them when
	     // applied to the chart. This allows the study to only compute the Fibonacci sequence up to the
	     // number of bars on the chart
            int tempLuc = 0;
            int prevLuc = 1;
            int luc = 3;
            while (startIndex + luc < Input.Close.Count)
            {
                lucasData[startIndex + luc - 1] = maxValue;
                tempLuc = luc;
                luc += prevLuc;
                prevLuc = tempLuc;
            }

            Output.Update("Lucas", lucasData);
            Output.Update("PaintBar", paintBarData);
        }

        // This is inserted to allow user to click on starting bar instead of manually inputting date and time
        public void lucStartCallback(int index)
        {
            // Reset the startPoint to the DateTime of the selected bar
            startPoint = Input.DateTimes[index];
            // Force the study to recalculate based on the new start point
            Calculate();
        }
    }

}
All Bloomberg code contributions to Traders’ Tips can also be found in the sample files provided with regular Sdk updates, and the studies will be included in the Bloomberg global study list.

THINKORSWIM.COM: FIBONACCI/LUCAS TIME SERIES
In his article in this issue, “Automated Techniques For Intraday Traders,” author Andrew Coles takes a look at the usage of mathematical number series in an attempt to forecast price movement. He demonstrates how an automated study that identifies Lucas and/or Fibonacci sequences can make these kind of time-based studies practical for the modern daytrader.
Following Coles’ lead, we have created a study file using our proprietary language, thinkScript, which accomplishes this aim. It can be applied to any size or aggregation in the platform once or multiple times, each of which can be set to show either Lucas or Fibonacci sequences. A sample chart implementation is shown in Figure 3.
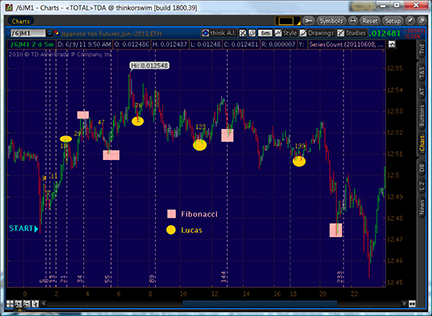
Figure 3: THINKORSWIM, FIBONACCI/LUCAS TIME SERIES INDICATOR
The code is shown here along with instructions for application:
- From our TOS charts, select Studies → Edit studies
- Select the “Studies” tab in the upper left-hand corner
- Select “New” in the lower left-hand corner
- Name the study (i.e. SeriesCount)
- Click in the script editor window, remove “plot Data = close;” and paste in the following:
input beginDate = 20110101; input beginTime = 0930; input mode = {default Fibonacci, Lucas}; input verticalLines = no; def after = daysFromDate(beginDate) > 0 or (daysFromDate(beginDate) == 0 and secondsFromTime(beginTime) > 0); rec barsSinceStart = if after then barsSinceStart[1] + 1 else 0; def coeff; def smallest; switch (mode) { case Fibonacci: coeff = Sqrt(5); smallest = 5; case Lucas: coeff = 1; smallest = 3; } def n = Floor(log(barsSinceStart * coeff + 0.5) / log((1 + Sqrt(5)) / 2)); def inSeries = n != n[1] and barsSinceStart >= smallest; plot Series = if inSeries then barsSinceStart else Double.NaN; Series.SetDefaultColor(GetColor(2)); Series.SetPaintingStrategy(PaintingStrategy.VALUES_ABOVE); DefineGlobalColor("Series", GetColor(2)); AddVerticalLine(verticalLines and inSeries, concat("", barsSinceStart), globalColor("Series")); - Select OK.

eSIGNAL: FIBONACCI/LUCAS TIME SERIES INDICATOR
For this month’s Traders’ Tip, we’ve provided the formula “Fibonacci_Lucas_Series.efs” based on Andrew Coles’ article in this issue, “Automated Techniques For Intraday Traders.”
The study contains formula parameters to set the series type (Fibonacci or Lucas), color, and start date for the series calculation, which may be configured through the Edit Chart window. This study is also configured for use in a Watch List window for custom sorting.
To discuss this study or download a complete copy of the formula code, please visit the Efs Library Discussion Board forum under the Forums link from the support menu at www.esignal.com, or visit our Efs KnowledgeBase at https://www.esignal.com/support/kb/efs/. The eSignal formula scripts (Efs) are also shown below.
"Fibonacci_Lucas_Series.efs"

/*********************************
Provided By:
    Interactive Data Corporation (Copyright © 2010)
    All rights reserved. This sample eSignal Formula Script (EFS)
    is for educational purposes only. Interactive Data Corporation
    reserves the right to modify and overwrite this EFS file with
    each new release.

Description:
    Fibonacci And Lucas Automated Techniques For Intraday Traders

Version:            1.00  14/06/2010

Formula Parameters:                     Default:
Fibonacci/Lucas                         Fibonacci
Color                                   Color.lime
Select Start Date                       First Bar On Chart
Start Date (mm/dd/yyyy)                 null
Start Time (hh:mm)                      00:00

Notes:
    The related article is copyrighted material. If you are not a subscriber
    of Stocks & Commodities, please visit www.traders.com.

**********************************/

var fpArray = new Array();
var barOffset = 0;
var bVersion = null;

function preMain() {

    setStudyTitle("Fibonacci/Lucas Series");
    setPriceStudy(true);
    setCursorLabelName("Last Value of Sequence");
    setPlotType(PLOTTYPE_FLATLINES);

    var x=0;
    fpArray[x] = new FunctionParameter("gFL", FunctionParameter.STRING);
    with(fpArray[x++]){
        setName("Fibonacci/Lucas");
        addOption("FIBONACCI");
        addOption("LUCAS");
        setDefault("FIBONACCI");
    }

    fpArray[x] = new FunctionParameter("gColor", FunctionParameter.COLOR);
    with(fpArray[x++]){
        setName("Color");
        setDefault(Color.lime);
    }

    fpArray[x] = new FunctionParameter("gFirstBar", FunctionParameter.STRING);
    with(fpArray[x++]){
        setName("Select Start Date");
        addOption("First Bar On Chart");
        addOption("User Defined");
        setDefault("First Bar On Chart");
    }

    fpArray[x] = new FunctionParameter("gDate", FunctionParameter.STRING);
    with(fpArray[x++]){
        setName("Start Date (mm/dd/yyyy)");
        setDefault("");
    }

    fpArray[x] = new FunctionParameter("gTime", FunctionParameter.STRING);
    with(fpArray[x++]){
        setName("Start Time (hh:mm)");
        setDefault("00:00");
    }
}

var bInit = false;
var startPos = 0;
var offsetBar = null;
var bFixColor = false;
var F1 = 5;
var F2 = 3;
var N = 1;
function main( gFL, gColor, gFirstBar, gDate, gTime )
{
    if (bVersion == null) bVersion = verify();
    if (bVersion == false) return;

    if (getCurrentBarIndex() == 0 && getBarState() == BARSTATE_CURRENTBAR && bFixColor) setBarBgColor(gColor);

    if ( !bInit )
    {
        if  ( gFL == 'LUCAS' )
        {
            F1 = 3;
            F2 = 1;
            N = 1;
        }
        if ( gFirstBar !=  "User Defined" )  offsetBar = 0;
        else
        {
            var xDate = gDate.split("/");
            var xTime = (!isDWM()) ? gTime.split(":") : new Array("0","0");
            var startDate = new Date(xDate[2], xDate[0], xDate[1], xTime[0], xTime[1]);
            startPos = startDate.getTime();
        }
        bInit = true;
        if (offsetBar == 0)
        {
                setBarBgColor(gColor);
                drawTextRelative(0, BottomRow2, "Start" , gColor, null, Text.FRAME | Text.PRESET | Text.CENTER
 , "Arial", 11, "Start" );
                return "START";
        }
    }
    if ( getBarState() == BARSTATE_NEWBAR )
    {
        if ( isNull(offsetBar) )
        {
            var currentDate = new Date(year(0), month(0), day(0), hour(0), minute(0));
            var currentPos = currentDate.getTime();
            if ( currentPos == startPos )
            {
                offsetBar = Math.abs(getOldestBarIndex() - getCurrentBarIndex());
                setBarBgColor(gColor);
                drawTextRelative(0, BottomRow2, "Start" , gColor, null, Text.FRAME | Text.PRESET | Text.CENTER,
 "Arial", 11, "Start" );
                return ("START");
            }
            if  ( currentPos > startPos  )
            {
                drawTextRelative(1, 20, " Date not availible ", Color.grey, null,
 Text.RELATIVETOLEFT|Text.RELATIVETOBOTTOM|Text.BOLD|Text.LEFT|Text.FRAME, null, 12, "dna");
                return ("Date not availible");
            }
        }
        else
        {
            if ( -getOldestBarIndex()-offsetBar-F1  == -getCurrentBarIndex() )
            {
                var b = F1;
                F1 +=F2;
                F2 = b;
                N++;
                bFixColor = true;
                setBarBgColor(gColor);
                drawTextRelative(0, BottomRow3, " "+ N +" ", gColor, null, Text.FRAME | Text.PRESET |
 Text.CENTER , "Arial", 11, "N"+N );
                drawTextRelative(0, BottomRow2, F2+ " bars" , gColor, null, Text.FRAME | Text.PRESET |
 Text.CENTER , "Arial", 11, F2 );
                return ""+F2;
            }
            else
            {
                bFixColor = false;
                var fromStart = -getOldestBarIndex()-offsetBar + getCurrentBarIndex();
                return ""+fromStart;
            }
        }
    }
}

function verify() {
    var b = false;
    if (getBuildNumber() < 779) {
        drawTextAbsolute(5, 35, "This study requires version 8.0 or later.",
            Color.white, Color.blue, Text.RELATIVETOBOTTOM|Text.RELATIVETOLEFT|Text.BOLD|Text.LEFT,
            null, 13, "error");
        drawTextAbsolute(5, 20, "Click HERE to upgrade.@URL=https://www.esignal.com/download/default.asp",
            Color.white, Color.blue, Text.RELATIVETOBOTTOM|Text.RELATIVETOLEFT|Text.BOLD|Text.LEFT,
            null, 13, "upgrade");
        return b;
    } else {
        b = true;
    }
    return b;
}
A sample chart is shown in Figure 4.
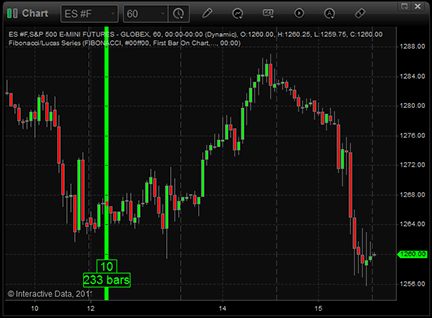
Figure 4: eSIGNAL, FIBONACCI AND LUCAS TIME SERIES INDICATOR

WEALTH-LAB: FIBONACCI/LUCAS TIME SERIES INDICATOR
This Traders’ Tip is based on “Automated Techniques For Intraday Traders” by Andrew Coles in this issue.
Wealth-Lab users can give these two time-based techniques a try and turn their screens into drawing boards. The code is shown below but is also available for instant download from Wealth-Lab’s “Open strategy” dialog. An additional library, “Community components,” is also available to Wealth-Lab customers for download from our site at www.wealth-lab.com (see the “Extensions” section). This additional library is required for the strategy to function.
See Figure 5.
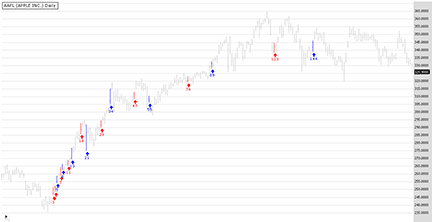
Figure 5: WEALTH-LAB, FIBONACCI AND LUCAS TIME SERIES INDICATOR. Here is a Wealth-Lab Developer 6.2 chart showing the Fibonacci/Lucas bar chart markup applied to a daily chart of AAPL (Apple Inc.). The Fibonacci bars are blue and the Lucas series are red.
Users should be aware that with methods that don’t have a rock-solid starting point, it’s an open question as to whether automatic line placement on the chart removes subjectivity. Our example strategy automates finding the starting point on the chart of any time frame by searching for the recent 10% peak or trough (whichever happened later) — the percentage is configurable by dragging the “reversal %” slider in the bottom-left part of the screen.
One thing’s for sure: If you draw enough lines on a chart, some of them are bound to hit important turning points.
The .odt file is also available here.
C# code for Wealth-Lab:

using System;
using System.Collections.Generic;
using System.Text;
using System.Drawing;
using WealthLab;
using WealthLab.Indicators;
using Community.Components;

namespace WealthLab.Strategies
{
	public class FibLucas : WealthScript
	{
		private StrategyParameter paramAmount;
		int[] fib = new int[] {5,8,13,21,34,55,89,144,233,377,610,987,1597,2584,4181,6765};
		int[] lucas = new int[] {3,4,7,11,18,29,47,76,123,199,322,521,843,1364,2207,3571};
		Font font = new Font(«Wingdings», 8, FontStyle.Bold);
		Font font2 = new Font(«Verdana», 7, FontStyle.Regular);
		string upArrow = Convert.ToChar(0x00E9).ToString();
		string dnArrow = Convert.ToChar(0x00EA).ToString();

		public FibLucas()
		{
			paramAmount = CreateParameter(«Reversal %», 10, 2, 50, 1);
		}
		// Marking bars
		private void Highlighter( int[] array, double barsSince, int bar, Color color)
		{
			for( int i = 0; i < array.GetLength(0); i++ ) {
				if( barsSince == array[i] ) {
					AnnotateBar(upArrow, bar, false, color, Color.Transparent, font);
					AnnotateBar(array[i].ToString(), bar, false, color, Color.Transparent, font2);
					SetBarColor( bar, color );
					break;
				}
			}
		}
		protected override void Execute()
		{
			// Variable definition, series creation and array initialization
			PeakTroughMode pct = PeakTroughMode.Percent;
			double amt = paramAmount.Value;
			Peak p = Peak.Series( High, amt, pct );
			PeakBar pb = PeakBar.Series( High, amt, pct );
			Trough t = Trough.Series( Low, amt, pct );
			TroughBar tb = TroughBar.Series( Low, amt, pct );
			Calculate c = new Calculate(this); // pass an instance of the WealthScript object
			DataSeries barsSince = new DataSeries(Bars,»Bars Since Start»);
			int markbar = -1; int init = -1;
			SetBarColors( Color.Silver,Color.Silver );
			HideVolume();

			// Build auxiliary binary wave
			DataSeries start = new DataSeries( Bars, «start» );
			for(int bar = Bars.Count-1; bar >= 0; bar--)
			{
				int i = Math.Max( (int)tb[bar], (int)pb[bar] );
				if( i > -1 ) {
					start[i] = i; init = i;
					break;
				}
				else
					start[i] = -1;
			}
			for(int bar = init; bar < Bars.Count; bar++)
			{
				// Building BarsSince series
				if( c.BarsSince( bar, CrossOver(bar, start, 0) ) == 0)
					markbar = bar;
				if( markbar > 0 )
					barsSince[bar] = bar - markbar;

				// Marking Fibonacci/Lucas bars
				Highlighter( fib, barsSince[bar], bar, Color.Blue );
				Highlighter( lucas, barsSince[bar], bar, Color.Red );
			}
		}
	}
}

AMIBROKER: FIBONACCI/LUCAS TIME SERIES INDICATOR
In “Automated Techniques For Intraday Traders” in this issue, author Andrew Coles presents a simple timing technique based on Fibonacci and Lucas series.
A ready-to-use, all-in-one formula for the article is presented here. To use it, enter the formula in the Afl Editor, then press “Insert indicator.”
The starting point of a time series can be selected either by a mouse click on a chart or via the parameters window, which can also be used to define colors and determine which series should be plotted, Lucas or Fibonacci.
AmiBroker code for Fibonacci/Lucas time series indicator
function DrawSeries( start, series, Color )
{
  x = BarsSince( start );

  result = 0;

  for( i = 0; ( bar = StrToNum( StrExtract( series, i ) ) ) != 0; i++ )
  {
     result += x == bar;
  }

  Plot( result, "", Color,
        styleHistogram | styleOwnScale | styleNoLabel, 0, 1 );
}

Plot( C, "Price", colorBlack, styleCandle );

FibSeries = "5,8,13,21,34,55,89,144,233,377,610,987,1597,2584,4181,6765";
LucSeries = "3,4,7,11,18,29,47,76,123,199,322,521,843,1364,2207,3571";

dn = ParamDate("Date", "", 0 );
tn = ParamTime("Time", "00:00:00", 0 );

bi = BarIndex();

if( ParamToggle("Start point", "Mouse select|Date input", 0 ) )
start = DateNum() == dn AND TimeNum() == tn;
else
start = bi == SelectedValue( bi );

if( start[ BarCount -1 ] )
  Title = "Click on chart to select starting point or enter date in the Parameters window";

fibon = ParamToggle("Fib Series", "Off|On", 1 );
fibcolor = ParamColor("Fib Color", colorRed );

lucon = ParamToggle("Lucas Series", "Off|On", 1 );
luccolor = ParamColor("Lucas Color", colorGreen );

if( fibon ) DrawSeries( start, FibSeries, fibcolor );
if( lucon ) DrawSeries( start, LucSeries , luccolor );
A sample chart is shown in Figure 6.
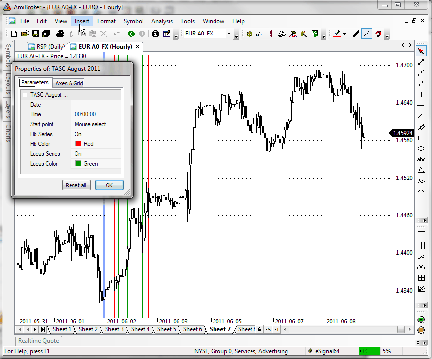
Figure 6: AMIBROKER, FIBONACCI AND LUCAS TIME SERIES INDICATOR. Here is an hourly price chart of EUR/USD with Fibonacci (red) and Lucas (green) series.

NEUROSHELL TRADER: FIBONACCI/LUCAS TIME SERIES INDICATORS
The Fibonocci and Lucas time target indicators described by Andrew Coles in his article in this issue, “Automated Techniques For Intraday Traders,” can be easily implemented with a few of NeuroShell Trader’s 800+ indicators. Simply select “New Indicator” from the Insert menu and use the Indicator Wizard to set up the following indicators:
BarsSince:
BarsSinceCond( And2( DateIS(Year, Month, Day), TimeIS(Hour, Minute, Second, 0.25)))

Fibonacci Series Time Target
Or4(Or4(A=B(BarsSince,5),A=B(BarsSince,8)),A=B(BarsSince,13),A=B(BarsSince,21)),
 Or4(A=B(BarsSince,34),A=B(BarsSince,55)),A=B(BarsSince,89),A=B(BarsSince,144)),
 Or4(A=B(BarsSince,233),A=B(BarsSince,377)),A=B(BarsSince,610),A=B(BarsSince,987)),
 Or4(A=B(BarsSince,1597), A=B(BarsSince,2584)), A=B(BarsSince,4181), A=B(BarsSince,6765)) )

Lucas Series Time Target
Or4(Or4(A=B(BarsSince,3),A=B(BarsSince,4)),A=B(BarsSince,7),A=B(BarsSince,11)),
 Or4(A=B(BarsSince,18),A=B(BarsSince,29)),A=B(BarsSince,47),A=B(BarsSince,76)),
 Or4(A=B(BarsSince,123),A=B(BarsSince,199)),A=B(BarsSince,322),A=B(BarsSince,521)),
 Or4(A=B(BarsSince,843), A=B(BarsSince,1364)), A=B(BarsSince,2207), A=B(BarsSince,3571)) )
Note that the BarsSinceCond indicator is found in the Advanced Indicator Set 2 add-on, while the DateIs and TimeIs indicators are found in the Advanced Indicator Set 3 add-ons.
Users of NeuroShell Trader can go to the Stocks & Commodities section of the NeuroShell Trader free technical support website to download a copy of this or any previous Traders’ Tips.
A sample chart is shown in Figure 7.
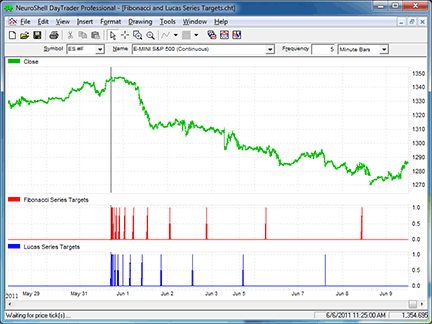
Figure 7: NEUROSHELL TRADER, FIBONACCI AND LUCAS TIME SERIES INDICATOR. Here is a NeuroShell Trader chart showing the Fibonacci and Lucas series time target indicators after a swing high.

AIQ: THREE BLACK CROWS PATTERN
The Fibonacci time zones discussed in “Automated Techniques For Intraday Traders” by Andrew Coles in this issue can be implemented using the Fibonacci time zone chart tool in Aiq with no additional programming required.
Thus, I am instead providing code for the “Three Black Crows” candle pattern that is discussed in Thomas Bulkowski’s June 2011 article, “Top 10 Candles That Work.”
Coding candlestick patterns requires quite a bit of interpretation, since these patterns are described in relative terms like a “tall” candle or “closes in the lower portion of the bar.” Depending on the interpretation given to these relative terms, we can get different results. In my code set, shown below, I provide inputs that allow for some of the adjustments. The three black crows pattern has the following rules:
- Must have three tall candles in a row
- Pattern occurs in an uptrend and the first candle is the highest high
- The last two candles must open in the real body range of the prior candle
- All three must close near the low
- The last two candles must have lows that are lower than the prior low.
“Tall” means that the bars’ high–low range is greater than the 10-day average range that occurs just prior to the start of the pattern. An uptrend is defined as a linear regression slope of the closes greater than zero. “Closing near the low” is based on how many candle zones are input, which are then used to divide the range of the bar into zones. “Closing near the low” means that the close must fall in the lowest zone. In addition, the author suggests testing in a bull market. Bull market is defined here as when the 200-bar moving average of the Standard & Poor’s 500 is greater than it was 10 bars ago. A bear market occurs whenever it is not a bull market.
I tested the pattern by entering at the close on the day the pattern is complete and exiting at the close six days later. This provides a test with five overnights and five full bars held after the pattern completes. I used the Russell 3000 list of stocks and tested from 1/15/1970 to 6/13/2011. In the table in Figure 8, I show the comparative results of bull, bear, and combined bull and bear. It appears that this pattern works in both bull and bear markets, but there may not be enough signals to build a trading system from just this pattern alone.
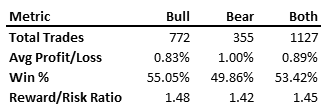
Figure 8: AIQ SYSTEMS, THREE BLACK CROWS PATTERN. This table shows the metrics for the three black crows candle pattern for the test period 1/15/1970 to 6/13/2011 using the Russell 3000 list of stocks.
The Aiq code is shown here and the Eds file for this technique can be downloaded from www.TradersEdgeSystems.com/traderstips.htm.
AIQ code for three black crows pattern

!TOP 10 CANDLES THAT WORK: THREE BLACK CROWS
!Author: Thomas N. Bulkowski, TASC June 2011
!Coded by: Richard Denning 6/14/11

!INPUTS:
RangeLen 	is 10.
CandleZones 	is 4.
HHLen 		is 10.
UpTrendLen 	is 10.

! ABBREVIATIONS:
C 	is [close].
C1	is valresult(C,1).
C2	is valresult(C,2).
H 	is [high].
L 	is [low].
L1	is valresult(L,1).
O 	is [open].
O1	is valresult(O,1).
OSD 	is offSetToDate(month(),day(),year()).

!BULL / BEAR MARKET DETERMINATION:
SPXc is TickerUDF("SPX",C).
Bull if simpleavg(C,200) > simpleavg(C,200,10).
Bear if not Bull.

!FUNCTIONS AND RULES FOR THREE BLACK CROWS CANDLE PATTERN:
Range is H - L.
HHoffset is scanany(H = ∧highresult(H,HHLen),HHLen) then OSD.
AvgRng is simpleavg(Range,RangeLen,∧HHoffset).
LowerZoneC if C < L + (Range * 1/CandleZones).
Tall if Range > AvgRng.
BlackCrow1 if Tall
	and LowerZoneC
	and slope2(C,UpTrendLen) > 0
	and  H = highresult(H,HHLen).
BlackCrow2 if Tall
	and LowerZoneC
	and O <= O1
	and O >= C1.
ThreeBlackCrows if valrule(BlackCrow1,2)
	and countof(BlackCrow2,2)=2
	and countof(L < L1,2)=2.
Bull3BlackCrows if Bull and ThreeBlackCrows.
Bear3BlackCrows if Bear and ThreeBlackCrows.

TRADERSSTUDIO: FIBONACCI/LUCAS TIME SERIES INDICATOR
In addition to providing TradersStudio code for the Fibonacci and Lucas indicators (color studies) based on Andrew Coles’ article in this issue, “Automated Techniques For Intraday Traders,” I have also provided several functions and the framework for session code for use in developing an intraday system using these time series.
In Figure 9, I show a color study on a five-minute chart of the emini S&P 500 futures contract (ES) for 9/19/2008. I started the time series at the 9:50 am bar, which was a low pivot. The white bars are the Fibonacci time series and the yellow bars are the Lucas time series, with both series starting at the 9:50 am low pivot. The terminal window shows the bars since the starting point.
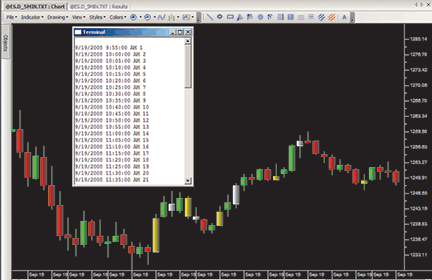
Figure 9: TRADERSSTUDIO, FIBONACCI AND LUCAS TIME SERIES INDICATORS. Here is a color study for the ES five-minute chart with white bars for the Fibonacci series and yellow bars for the Lucas series.
The TradersStudio code for the Fibonacci and Lucas indicators can be downloaded from the TradersStudio website at www.TradersStudio.com → Traders Resources → FreeCode or from www.TradersEdgeSystems.com/traderstips.htm. It is also shown here.
TradersStudio code for Fibonacci/Lucas time series indicator

'AUTOMATED TECHNIQUES FOR INTRADAY TRADERS
'Author: Andrew Coles, TASC Aug 2011
'Coded by: Richard Denning
'www.TradersEdgeSystems.com

Sub AUTO_TECH_SYS(startT)
Dim barsSinceStartT As BarArray
Dim isFib
Dim isLucas
barsSinceStartT = AUTO_TECH_BARS(startT)
If barsSinceStartT > 0 Then
    isFib = IS_FIB_NUM(barsSinceStartT)
    isLucas = IS_LUCAS_NUM(barsSinceStartT)
    Print FormatDateTime(Date)," ",FormatDateTime(Time)," ",barsSinceStartT
End If
'USE THE FOLLLOWING FORMAT TO BUILD YOUR TRADING SYSTEM
'   USING THE FIB AND/OR LUCAS TIME SERIES:
'If isFib = 1 Then Buy("LE_FIB",1,0,Market,Day)
'If isLucas = 1 Then Buy("LE_LUCAS",1,0,Market,Day)
'If BarsSinceEntry > 0 Then ExitLong("LX","",1,0,Market,Day)
End Sub
'-------------------------------------------------------
Function AUTO_TECH_BARS(startT)
Dim startTm
Dim barsSinceStart
Dim startBar As BarArray
startTm = MigrateTime(startT)
If Time = startTm Then
    startBar = BarNumber
Else startBar = startBar[1]
End If
If Time > startTm Then
    barsSinceStart = BarNumber - startBar
    'Print FormatDateTime(Date)," ",FormatDateTime(Time)," ",barsSinceStart
End If
AUTO_TECH_BARS = barsSinceStart
End Function
'---------------------------------------------------------------------------
function IS_FIB_NUM(number)
Dim answer
If number > 6765 Then
    IS_FIB_NUM = -1
Else
    If number <= 144 Then
        If number = 5 Or number = 8 Or number = 13 Or number = 21 Or number = 34 Or number = 55 Or number =
 89 Or number = 144 Then
            IS_FIB_NUM = 1
    Else
        If number = 233 Or number = 377 Or number = 610 Or number = 987 Or number = 1597 Or number = 2584 Or
 number = 4181 Or number = 6765 Then
            IS_FIB_NUM = 1
        Else
            IS_FIB_NUM = 0
        End If
        End If
    End If
End If
End Function
'---------------------------------------------------------------------------------------------------------
----------------------------------
function IS_LUCAS_NUM(number)
Dim answer
If number > 3571 Then
    IS_LUCAS_NUM = -1
Else
    If number <= 76 Then
        If number = 3 Or number = 3 Or number = 7 Or number = 11 Or number = 18 Or number = 29 Or number =
 47 Or number = 76 Or number = 123 Then
            IS_LUCAS_NUM = 1
    Else
        If number = 199 Or number = 322 Or number = 521 Or number = 843 Or number = 1364 Or number = 2207
 Or number = 3571 Then
            IS_LUCAS_NUM = 1
        Else
            IS_LUCAS_NUM = 0
        End If
        End If
    End If
End If
End Function
'---------------------------------------------------------------------------------------------------------
----------------------------------
sub FibColorBar(startT)
Dim isFib
Dim startTm
Dim BarsSinceStartT
BarsSinceStartT = AUTO_TECH_BARS(startT)
If BarsSinceStartT > 0 Then isFib = IS_FIB_NUM(BarsSinceStartT)
If isFib = 1 Then barcolor(0) = vbWhite
End Sub
'-----------------------------------------------------------------
sub LucasColorBar(startT)
Dim isLucas
Dim startTm
Dim BarsSinceStartT
BarsSinceStartT = AUTO_TECH_BARS(startT)
If BarsSinceStartT > 0 Then isLucas = IS_LUCAS_NUM(BarsSinceStartT)
If isLucas = 1 Then barcolor(0) = vbYellow
End Sub
'------------------------------------------------------------------

TRADECISION: FIBONACCI/LUCAS TIME SERIES INDICATOR
In “Automated Techniques For Intraday Traders” in this issue, author Andrew Coles demonstrates how to automate the Fibonacci bar-counting technique and the Lucas number series to apply to intraday charts.
You can use Tradecision’s Indicator Builder to recreate the Fibonacci and Lucas series indicators. To import the strategy into Tradecision, visit the area “Traders’ Tips from Tasc Magazine” at www.tradecision.com/support/tasc_tips/tasc_traders_tips.htm, or copy the code from below.
A sample chart is shown in Figure 10.
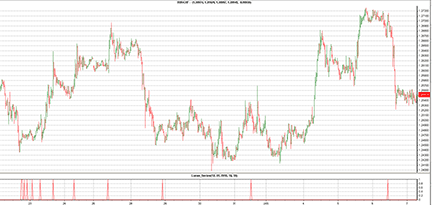
FIGURE 10: TRADECISION, LUCAS SERIES INDICATOR. Here is a forex chart with a Lucas series plotted on the point where a trend reversal takes place.
Tradecision code for Fibonacci series indicator:

inputs
StartingMonth:"Starting Month", 1, 1, 12;
StartingDay:"Starting Day of Month", 1, 1, 31;
StartingYear:"Starting Year", 2004, 1980, 2100;
StartingHour:"Starting Hour", 1, 0, 24;
StartingMinute:"Starting Minute", 1, 0, 60;
end_inputs

var
x:=0;
StartBar:=0;
startFound:=false;
end_var

if HistorySize > 0 then  begin
   startFound:=startFound\1\;
   StartBar:=startBar\1\;
                         end;

if (not startFound and Year = StartingYear and Month = StartingMonth and DayOfMonth = StartingDay and Hour
 = StartingHour and Minute = StartingMinute) then
begin
   startBar:=BarNumber();
   startFound:=true;
end;

if (not startFound) then
   return 0;

x:= barnumber - startbar;
if x = 5 or x = 8 or x = 13 or x = 21 or x = 34 or x = 55 or x = 89 or x = 144 or x = 233 or x = 377 or x =
 610 or x = 987 or x = 1597 or x = 2584 or x = 4181 or x = 6765 then
return 1;

return 0;


Tradecision code for Lucas series indicator:

inputs
StartingMonth:"Starting Month", 1, 1, 12;
StartingDay:"Starting Day of Month", 1, 1, 31;
StartingYear:"Starting Year", 2004, 1980, 2100;
StartingHour:"Starting Hour", 1, 0, 24;
StartingMinute:"Starting Minute", 1, 0, 60;
end_inputs

var
x:=0;
StartBar:=0;
startFound:=false;
end_var

if HistorySize > 0 then  begin
   startFound:=startFound\1\;
   StartBar:=startBar\1\;
                         end;

if (not startFound and Year = StartingYear and Month = StartingMonth and DayOfMonth = StartingDay and Hour
 = StartingHour and Minute = StartingMinute) then
begin
   startBar:=BarNumber();
   startFound:=true;
end;

if (not startFound) then
   return 0;

x:= barnumber - startbar;
if x = 3 or x = 4 or x = 7 or x = 11 or x = 18 or x = 29 or x = 47 or x = 76 or x = 123 or x = 199 or x = 322
 or x = 512 or x = 843 or x = 1364 or x = 2207 or x = 3571 then
return 1;

return 0;

NINJATRADER: FIBONACCI/LUCAS TIME SERIES INDICATOR
We have implemented the FibAndLucasTimeSequence indicator based on “Automated Techniques For Intraday Traders” by Andrew Coles in this issue. This indicator is available for download at www.ninjatrader.com/SC/August2011SC.zip.
Once you have it downloaded, from within the NinjaTrader Control Center window, select the menu File → Utilities → Import NinjaScript and select the downloaded file. This indicator is for NinjaTrader version 7 or greater.
You can review the indicator source code by selecting the menu Tools → Edit NinjaScript → Indicator from within the NinjaTrader Control Center window and selecting “FibAndLucasTimeSequence.”
A sample chart implementing the strategy is shown in Figure 11.
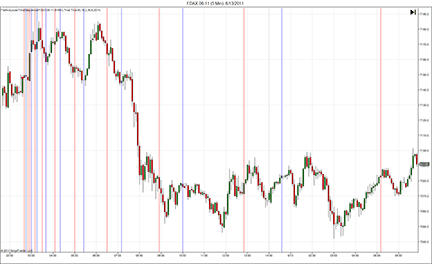
Figure 11: NINJATRADER, FIBONACCI AND LUCAS TIME SEQUENCE INDICATOR. This screenshot shows the FibAndLucasTimeSequence indicator applied to a five-minute chart of the FDAX June 2011 (FDAX 06-11).

TRADE NAVIGATOR: FIBONACCI/LUCAS TIME SERIES INDICATOR
You can use TradeSense to recreate the automated techniques described by Andrew Coles in his article in this issue, “Automated Techniques For Intraday Traders.”
However, if you have Trade Navigator Gold, you have an even easier way to display Coles’ indicators on a chart. The Fibonacci Time Zone drawing tool in Trade Navigator Gold allows you to add these indicators to a chart with just two clicks. Simply click the Fibonacci Time Zone button in the drawing tools, then click the starting point on the chart (that is, the button named “Fib Time Zone”).

See Figure 12.
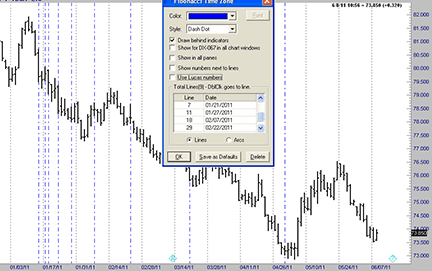
Figure 12: TRADE NAVIGATOR, FIBONACCI AND LUCAS TIME SERIES INDICATOR. The Fibonacci Time Zone drawing tool in Trade Navigator Gold allows you to add Andrew Coles’ Fibonacci and Lucas time series indicators to a chart with just two clicks. Simply click the Fibonacci Time Zone button in the drawing tools, then click the starting point on the chart (that is, the button named “Fib Time Zone”).
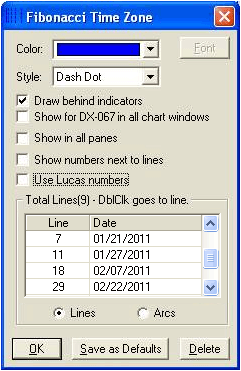
You can display this drawing tool as either lines or arcs (Figure 13). Select the Lucas series or Fibonacci series to match Coles’ examples. The Fibonacci Time Zone tool automatically uses the Fibonacci series unless you place a checkmark in the “Use Lucas numbers” option.
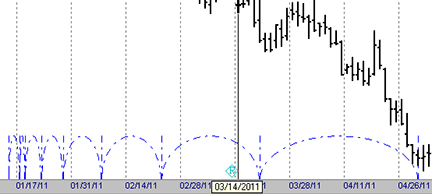
Figure 13: TRADE NAVIGATOR, Fibonacci Time Zone tool. The drawing tool can display the indicator as either lines or arcs.
This drawing tool will give you everything you need to employ the techniques presented in Coles’ article.
If you have the Greenblatt library in your version of Trade Navigator, the drawing tool will be called the Greenblatt Time Zone. The Greenblatt Time Zone tool allows you to choose Lucas or Fibonacci series using a dropdown menu.

UPDATA: FIBONACCI/LUCAS TIME SERIES INDICATOR
This tip is based on “Automated Techniques For Intraday Traders” by Andrew Coles in this issue.
In his article, Coles develops a chart overlay based on the Fibonacci and Lucas number series. Users can select a point to initialize the program, and the indicator will highlight data points from this based on the two series. The version of the Updata code that we’ve prepared (shown below) calculates values within a loop, and so can be extended beyond the numbers given in the article.
This Updata code will be in the Updata Library and may be downloaded by clicking the Custom menu and then either library. Those who cannot access the library due to a firewall may paste the code shown below into the Updata Custom editor and save it.
PARAMETER "DD" #DD=01
PARAMETER "MM" #MM=01
PARAMETER "YYYY" #YYYY=2011
NAME "Fibonacci & Lucas Series" ""
DISPLAYSTYLE 2LINES
INDICATORTYPE CHART SUPERIMPOSELEFT
PLOTSTYLE LINE RGB(255,0,0)
PLOTSTYLE2 LINE RGB(0,0,255)
@PrevLucas=0
@PrevFib=0
@Prev2Lucas=0
@Prev2Fib=0
@NextFibDate=0
@NextLucasDate=0
#StartDate=0
FOR #CURDATE=DATE(#DD,#MM,#YYYY) TO #LASTDATE
    #StartDate=DATE(#DD,#MM,#YYYY)
    @Plot=0
    @Plot2=0
    'Fibonacci Date
    If #CURDATE=#StartDate+5
       @PrevFib=5
       @NextFibDate=8
       @Plot=1
    ElseIf #CURDATE=#StartDate+@NextFibDate
       @Prev2Fib=@PrevFib
       @PrevFib=@NextFibDate
       @NextFibDate=@PrevFib+@Prev2Fib
       @Plot=1
    EndIf
    'Lucas Date
    If #CURDATE=#StartDate+4
       @PrevLucas=4
       @NextLucasDate=7
       @Plot2=1
    ElseIf #CURDATE=#StartDate+@NextLucasDate
       @Prev2Lucas=@PrevLucas
       @PrevLucas=@NextLucasDate
       @NextLucasDate=@PrevLucas+@Prev2Lucas
       @Plot2=1
    EndIf
NEXT
A sample chart is shown in Figure 14.
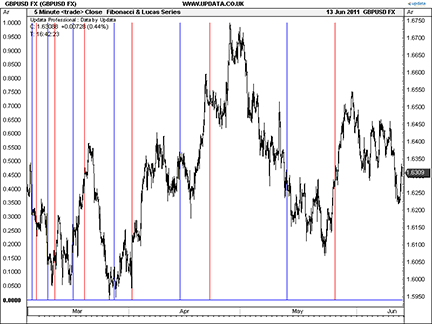
FIGURE 14: UPDATA, FIBONACCI AND LUCAS TIME SERIES INDICATOR. Here is an example of the Fibonacci (red) and Lucas (blue) number series applied to five-minute resolution GBP/USD data from March 2011.
MICROSOFT EXCEL: FIBONACCI/LUCAS TIME SERIES INDICATORS
In “Automated Techniques For Intraday Traders” in this issue, author Andrew Coles begins a two-part exploration of time-based market studies. In this article, he makes use of intervals based on the Fibonacci and Lucas time series.
I do not have ready access to intraday data, so this Excel implementation uses end-of-day data. But as Coles notes in his article, the only real difference between intraday, daily, weekly, or longer time frames is how one goes about specifying the starting bar for a given Lucas or Fibonacci study.
After the starting bar for a given study series is established, it’s just a matter of performing relatively simple Excel formula jiujitsu to determine the bar count matchups relative to that starting bar.
In an Excel workbook, I have provided the ability to select and plot up to three Fibonacci and three Lucas number studies at the same time. Figure 15 shows plots for Fibonacci A, Lucas A, and Lucas C.
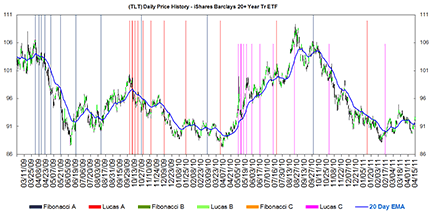
Figure 15: MICROSOFT EXCEL, FIBONACCI AND LUCAS TIME SERIES STUDIES. The spikes have been dynamically scaled to a different height for each series to assist in visual discrimination between series of similar color.
As you can see from this figure as well as from Coles’ examples, the chart starts to get a little busy. Following Coles’ example in his Figure 1 of his article, I have dynamically scaled the spikes for each series to a different height to assist in visually discriminating between series of similar color.
If you have access to historical intraday data, the Notes tab outlines the simple cell format changes you would need to make in order to use this workbook with intraday data.
This workbook incorporates the chart data windowing ability I introduced in previous Excel Traders’ Tips. To take advantage of this feature, you will need to enable Vba macro content when prompted. Even if you choose not to enable Vba macro content, you may view the macros after you open the spreadsheet by using Alt-F11 to open the Vba integrated development environment.
Click this link: FibonacciAndLucasNumberStudies.xls to download the spreadsheet file.

TRADESIGNAL: FIBONACCI/LUCAS TIME SERIES INDICATOR
The automatic time-based forecast (Atb) indicator described by Andrew Coles in his article in this issue, “Automated Techniques For Intraday Traders,” can easily be used with our online charting tool at www.tradesignalonline.com.
Just check the “Infopedia” section for our Lexicon. You will see the indicator, which you can make available for your personal account. Click on it and select “Open script.” The indicator will be immediately available for you to apply on any chart (Figure 16). You can also apply the indicator twice to use Fibonacci bar counting and Lucas time series simultaneously.
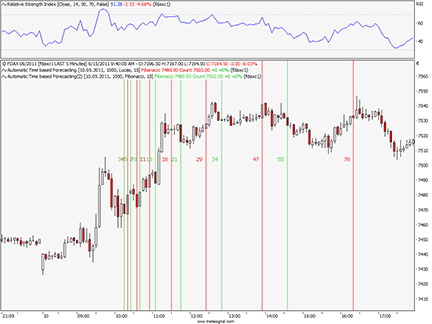
FIGURE 16: TRADESIGNALONLINE, automatic time-based forecast (Atb) indicator. Here is Tradesignal Online with the automatic time-based forecast indicator on an intraday chart of DAX futures.
The code is shown below, or can be downloaded here: TradeSignal_1108.eqi
TradeSignal code
Meta:
	Weblink ("https://www.tradesignalonline.com/lexicon/view.aspx?id=17034"),
	Synopsis("Automatic time based forecase indicator based on the article a from the 08/2011 issue of
Stocks & Commodities."),
	ShortCode("ATB"),
	AutoScale( False ),
	Subchart( False );

Inputs:
	Start_Cond( Bars_Back, Date_Time ),
	Bars( 500 ),
	Start_Date( "02.01.2011" ),
	Start_Time( 1000 ),
	Select_Count( Fibonacci, Lucas ),
	Number_Targets( 10 , 1 ),
	Color( Black );

Vars:
	targetBar, targetCounter, seedVal, prevSeedVal, startCond;

If Start_Cond = 0 Then
	startCond = CurrentBar = LastBar - Bars
Else startCond = Date = ResolveDate( Start_Date ) And Time = Start_Time ;

If startCond Then
	Begin
		If Select_Count = 0 Then
			Begin
				prevSeedVal = 0;
				seedVal = 1;
				targetBar = prevSeedVal + seedVal;
			End
		Else
			Begin
				prevSeedVal = 2;
				seedVal = 1;
				targetBar = prevSeedVal + seedVal;
			End;

		Print( targetBar, seedVal, prevSeedVal );

		For targetCounter = 1 To Number_Targets - 1 Do
			Begin
				If Select_Count = 0 Then
					Begin
						seedVal = prevSeedVal;
						prevSeedVal = targetBar;
						targetBar = prevSeedVal + seedVal;

					End
				Else
					Begin
						prevSeedVal = seedVal;
						seedVal = targetBar;

						targetBar = prevSeedVal + seedVal;
					End;

				Print( targetBar, seedVal, prevSeedVal );

				If targetBar > 2 Then
					Begin
						DrawSymbol[-targetBar]( High, "Fibonacci", SymbolVerticalLine, 1, Color, Color );
						DrawText[Neg(targetBar-1)]( High[1] of 'Data1 D', "Count", Cstr( targetBar ), 12, Color,
 AlignTop + AlignRight );
					End;
			End;
	End;
// *** Copyright tradesignal GmbH ***
// *** www.tradesignal.com ***

VT TRADER: FIBONACCI/LUCAS TIME SERIES INDICATOR
Our Traders’ Tip this month is based on “Automated Techniques For Intraday Traders” in this issue by Andrew Coles.
In the article, which is the first of two parts, Coles discusses Fibonacci bar-counting and the Lucas number series. He describes how these techniques can be automated and applied to intraday chart analysis.
We’ll be offering a Fibonacci/Lucas time series indicator for download in our VT client forums at https://forum.vtsystems.com, along with hundreds of other precoded and free indicators and trading systems. The VT Trader step-by-step instructions for recreating the Fibonacci/Lucas time series indicator are as follows:
- VT Trader’s Ribbon→Technical Analysis menu→Indicators group→Indicators Builder→[New] button
- In the General tab, type the following text into each corresponding text box:
Name: TASC - 08/2011 - Fibonacci/Lucus Time Series Function Name Alias: tasc_fibLucasSeries Label Mask: TASC - 08/2011 - Fibonacci/Lucus Time Series (Start M/D/Y H:M: %sm%/%sd%/%sy% %sh%:%se%) Placement: New Frame Data Inspection Alias: Fib / Lucus Time Series - In the Input Variable(s) tab, create the following variables:
[New] button...
Name: sm
Display Name: Starting Month
Type: integer (with bounds)
Default: 1
Min Bounds: 1
Max Bounds: 12

[New] button...
Name: sd
Display Name: Starting Day of Month
Type: integer (with bounds)
Default: 1
Min Bounds: 1
Max Bounds: 31

[New] button...
Name: sy
Display Name: Starting Year
Type: integer (with bounds)
Default: 2011
Min Bounds: 1980
Max Bounds: 2100

[New] button...
Name: sh
Display Name: Hour
Type: integer (with bounds)
Default: 0
Min Bounds: 0
Max Bounds: 23

[New] button...
Name: se
Display Name: Minute
Type: integer (with bounds)
Default: 0
Min Bounds: 0
Max Bounds: 59

[New] button...
Name: fns
Display Name: Show Fibonacci Series?
Type: enumeration
Default: Yes (* To set up list: click [..] button -> click [New] Button -> type "No" -> click [New] button
 -> type "Yes" -> click [OK] button)

[New] button...
Name: lns
Display Name: Show Lucas Series?
Type: enumeration
Default: Yes (* To set up list: click [..] button -> click [New] Button -> type "No" -> click [New] button
 -> type "Yes" -> click [OK] button)
- In the Output Variable(s) tab, create the following variables:
[New] button...
Var Name: Fibonacci
Name: (Fibonacci)
Line Color: blue
Line Width: slightly thicker
Line Type: histogram

[New] button...
Var Name: Lucas
Name: (Lucas)
Line Color: red
Line Width: slightly thicker
Line Type: histogram
- In the Horizontal Line tab, create the following horizontal lines:
[New] button...
Value: 0
Line Color: black
Line Width: thin
Line Type: dashed
- In the Formula tab, copy and paste the following formula:
{Provided By: Capital Market Services, LLC & Visual Trading Systems, LLC} {Copyright: 2011} {Description: TASC, August 2011 - "About Fibonacci and Lucus - Automated Techniques for Intraday Traders" by Andrew Coles, PhD} {File: tasc_fibLucasSeries.vtscr - Version 1.0} start:= sd=DayOfMonth() AND sm=Month() AND sy=Year() AND sh=Hour() AND se=Minute(); x:= BarsSince(start); Fibonacci:= fns=1 AND ( x=5 OR x=8 OR x=13 OR x=21 OR x=34 OR x=55 OR x=89 OR x=144 OR x=233 OR x=377 OR x=610 OR x=987 OR x=1597 OR x=2584 OR x=4181 OR x=6765 ); Lucas:= lns=1 AND ( x=3 OR x=4 OR x=7 OR x=11 OR x=18 OR x=29 OR x=47 OR x=76 OR x=123 OR x=199 OR x=322 OR x=521 OR x=843 OR x=1364 OR x=2207 OR x=3571 ); - Click the “Save” icon in the toolbar to finish building the Fibonacci/Lucas time series indicator.
To attach the indicator to a chart (Figure 17), click the right mouse button within the chart window and then select “Add Indicator” → “Tasc - 08/2011 - Fibonacci/Lucas Time Series” from the indicator list. To learn more about VT Trader, visit www.vtsystems.com.
Figure 17: VT TRADER, FIBONACCI/LUCAS TIME SERIES INDICATOR. Here is the Fibonacci/Lucas time series indicator attached to a EUR/USD one-hour candlestick chart.

FIBONACCI/LUCAS TIME SERIES INDICATOR — COLES ARTICLE CODE
MetaStock for intraday application of fibonacci series
sm:=Input("starting month",1,12,1);
sd:=Input("starting day of month",1,31,1);
sy:=Input("starting year",1980,2100,2000);
sh:=Input("hour", 1,24,1);
se:=Input("minute",0,60,0);

start:= sd=DayOfMonth() AND sm=Month() AND sy=Year() AND sh=Hour() AND se=Minute();

x:=BarsSince(start);

If(x=5,1,0);
If(x=8,1,0);
If(x=13,1,0);
If(x=21,1,0);
If(x=34,1,0);
If(x=55,1,0);
If(x=89,1,0);
If(x=144,1,0);
If(x=233,1,0);
If(x=377,1,0);
If(x=610,1,0);
If(x=987,1,0);
If(x=1597,1,0);
If(x=2584,1,0);
If(x=4181,1,0);
If(x=6765,1,0)
MetaStock for intraday application of lucas series
sm:=Input("starting month",1,12,1);
sd:=Input("starting day of month",1,31,1);
sy:=Input("starting year",1980,2100,2000);
sh:=Input("hour", 1,24,1);
se:=Input("minute",0,60,0);

start:= sd=DayOfMonth() AND sm=Month() AND sy=Year() AND sh=Hour() AND se=Minute();

x:=BarsSince(start);

If(x=3,1,0);
If(x=4,1,0);
If(x=7,1,0);
If(x=11,1,0);
If(x=18,1,0);
If(x=29,1,0);
If(x=47,1,0);
If(x=76,1,0);
If(x=123,1,0);
If(x=199,1,0);
If(x=322,1,0);
If(x=521,1,0);
If(x=843,1,0);
If(x=1364,1,0);
If(x=2207,1,0);
If(x=3571,1,0)