CHARTING
Trading Opportunities
Channeling Into Forex Profits
Forex pairs are usually considered to move in defined trends. Here’s a trend-trading technique that can be applied to trading currency pairs or crosses.
For both professionals and novices to master the game of trading, they have to learn and adopt certain strategies to help them achieve consistent profitability. To do this, specific price patterns need to be identified on the price charts and utilized as one of the tools to execute trades. My focus is on price channels. I will define what a price channel is, identify its importance both in technical analysis and trading, and establish how they are formed as well as how traders can use them to better enhance their trading decisions.
What is a price channel?
A price channel is a chart pattern bound by upper and lower trendlines. This pattern can occur in a downtrend and uptrend. The two lines can also be called boundaries, with the upper one acting as resistance and the lower one acting as support. Price channels can be bullish, bearish, or sideways and short, medium, or long term, depending on which time frame you are looking at.
Now that you know the basic definition of a channel, let’s turn to its characteristics.
Characteristics of a channel
Channeling as a trading pattern in technical analysis can be used in different ways to enhance your trading and execution. It creates trading opportunities, meaning it gives you clues as to where the market is headed in short, medium, and long terms.

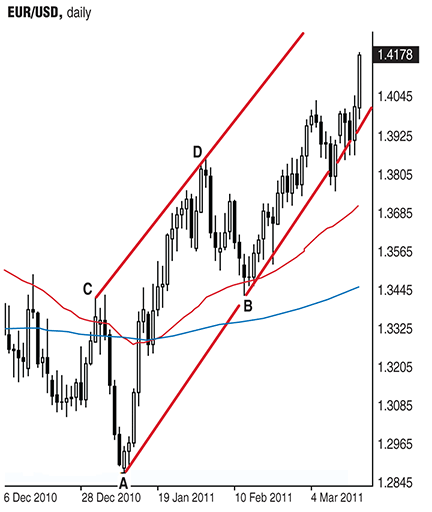
Figure 1: BULLISH CHANNEL. For a channel to form, there must be a minimum of two points connecting the upper trendline and two points to connect the lower trendline. The first point of the lower channel line will start from the point labeled A. The next point will be at the next higher low (point B). The upper trendline will begin at point C and connect to the next higher high at point D.