Letters To The Editor
September 2011 Letters To The Editor
The editors of S&C invite readers to submit their opinions and information on subjects relating to technical analysis and this magazine. This column is our means of communication with our readers. Is there something you would like to know more (or less) about? Tell us about it. Without a source of new ideas and subjects coming from our readers, this magazine would not exist.
Address your correspondence to: Editor, Stocks & Commodities, 4757 California Ave. SW, Seattle, WA 98116-4499, or E-mail to editor@traders.com. All letters become the property of Technical Analysis, Inc. Letter-writers must include their full name and address for verification. Letters may be edited for length or clarity. The opinions expressed in this column do not necessarily represent those of the magazine. —Editor
COLOR-BASED SYSTEM FOR SHORT-TERM TRADING
 Editor,
The color-based system presented by Edgar Kraut in his July 2011 article (“A Color-Based System For Short-Term Trading”) looked promising and simple. However, using the Excel spreadsheet example given in your Traders’ Tips section in that same issue, I recoded it into Mechanica Professional, but I did not get anything close to the performance shown in the article. I’m fairly sure I coded it correctly because I get the same color bars as those shown in Figure 6 in the article and the same number (98) of bars (45 green bars and 53 blue bars) in the first trading period (4/17/2002 to 4/17/2003) shown in the article’s Figure 8. So it seems that there must be something wrong with my trailing 1% exit.
Since closing prices are used to color the bars and enter the trade, I assume that the author means to enter on the open the next day and use a 1% trailing stop, but he doesn’t say whether that stop is based on the close of the previous day or his open fill price. For there to be 98 trades, that means every trade had to have been entered and exited on the same day, and I don’t see how that could happen with a 1% trailing stop 98 out of 98 times, especially using intraday data.
I would appreciate it if the author clarified his exit and how he managed to get 98 one-day trades with a 1% trailing stop.
Bob Dannegger
See also the next letter and reply.—Editor
MORE ON THE COLOR-BASED SYSTEM FOR SHORT-TERM TRADING
Editor,
When I read “A Color-Based System for Short-Term Trading” in the July 2011 issue of Stocks & Commodities, I was inspired to look further into author Edgar Kraut’s proposed system. After verifying similar results on daily data, I ran the system on five-minute bars — with untradable results. I came to the same conclusion that the StrataSearch coders in your Traders’ Tips section in that same issue came to: The trailing stop in Kraut’s system triggers off the high of the bar, which is unknown in real trading.
Duane
Author Edgar Kraut replies:
A number of readers report being unable to reproduce the results in Figure 8. As it turns out, the high percentage of profitability that was reported in the article for the color-based system was in error. This is because (as observed by Tomasz Janeczko in the July 2011 Traders’ Tips section) a one-bar delay was not applied to the trailing stop. Once the more realistic one-bar delay is applied, the profitability drops significantly.
In the same Traders’ Tips section, both the Aiq and StrataSearch contributions modified the basic color-based system to improve its profitability. Those Traders’ Tips can be found at the Stocks & Commodities website, Traders.com, in the Traders’ Tips section in the July 2011 issue.
When a one-period trailing stop delay is used, the MetaStock backtest results (Figure 8 of the article) become more accurate. A corrected equity curve for the period 4/17/2002 to 4/17/2003 on Spy data (using a one-period trailing stop delay) is shown in Figure 1A.
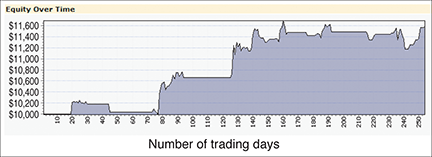
FIGURE 1A: REVISED EQUITY CURVE FROM EDGAR KRAUT. Here is the corrected equity curve for the color-based system after including a trailing stop delay of one period.
The digital version of the July 2011 issue at Traders.com containing the “Color-Based System” article will show the corrected backtest results and equity curve.
We regret any inconvenience this has caused.
As for why the problem occurred, the problem was with the built-in trailing stop implemented in MetaStock. A representative of MetaStock explained the following with regard to how trailing stops work in MetaStock:
All stops are designed so they can be triggered the same day the trade is opened. For profit-target stops and maximum-loss stops, this is not an issue. However, the trailing stop has to calculate profit gained and then set the stop based on that number.
On the first day, the most favorable price is used for the highest profit point. This means that, for long trades, the profit is equal to the high of the bar minus the entry price. The trailing stop’s percentage is multiplied by the profit and the result is subtracted from the high price. Then MetaStock checks to see whether the stop was triggered by the low price of the bar being less than or equal to the stop level. Even if you set the stop to 100%, the entry price itself will trigger the stop. It is triggered at the stop level so the trade always makes a profit.
What makes this unrealistic is the calculation off the high price. There is no way to know when the high is reached. If you’re two hours into the trading day and the price is $0.25 above the entry price, are you at the high? You have no way to know.
To have a realistic and tradable trailing stop, MetaStock suggests you either: 1) Set the trailing stop’s period to one or more; or, 2) Code the trailing stop in the exit condition with the MetaStock formula language.
PRICE ZONE OSCILLATOR
 Editor,
After reading “Entering The Price Zone” by Walid Khalil and David Steckler in the June 2011 S&C, I was curious as to why the price zone oscillator (Pzo) would generate a sell signal in the middle of an uptrend that continued for another 39 days (see Figure 2 on page 30 of the June 2011 issue). So I recreated their chart of the Dia daily between February and July 2010 and added the volume zone oscillator (Vzo) that they had introduced in their previous article (“In The Volume Zone,” May 2011 S&C). I wanted to see whether a bullish divergence between the Pzo, which Figure 3 plots, and Vzo, which Figure 3 did not plot, may have prevented the premature sell. It did not (see Figure 2).
Note that on 2/16/2010, Vzo was ahead of Pzo (4.20 vs. 3.28), thereby confirming the Pzo buy signal. Then on 3/18/2010, Pzo was ahead of Vzo (72.09 vs. 70.44), thereby confirming the premature sell signal. Although this was a profitable trade, the trader would have made another 4% had he or she just held the position until the price crossed below its 50-day exponential moving average (Ema).
I plan to use the Pzo/Vzo indicators to assess the strength of a trend, but based on the few weeks that I have used them, I do not think that they can reliably predict when a trend begins or ends. My compliments to Khalil for developing these simple but elegant indicators, and my thanks to Stocks & Commodities for publishing their articles.
Chris Pflum
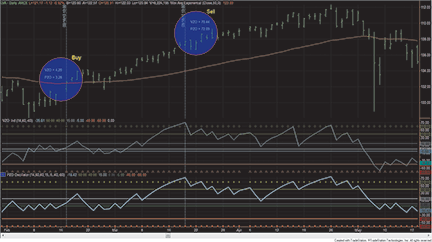
FIGURE 2: PRICE ZONE OSCILLATOR, FEBRUARY�JULY 2010. Here is a chart supplied by reader Chris Pflum of the price zone oscillator (PZO) on the daily DIA with the volume zone oscillator (VZO) added.
Editor’s note: The Pzo and Vzo indicators were created by Walid Khalil.
Author David Steckler replies:
Thanks for writing. You are correct that both Pzo and Vzo would have exited the Dia trade when the oscillators dropped from above +60 on 3/18/2010 (Pzo was 72.09 and Vzo was 70.44) to below +60 on 3/19/2010 (Pzo was 48.89 and Vzo was 37.20).
By the nature of their construction, oscillators don’t always catch the very beginning or end of a trending move. What usually happens is that as the trend matures, if the Vzo or Pzo gets you out early, you will have an opportunity for a second or third bite at the apple. You can see this in the Pzo chart of Dia from October 2009 through January 2010.
On 10/2/2009 the Pzo was -42.89 and on 10/5/2009 it was -23.94. One of the buy signals in an uptrend (price is above the 60-day Ema and Adx > 18) is when Pzo rises from below -40 to above -40. An end-of-day entry would have bought Dia at 95.71. Even though Pzo rose above and fell below +40 in mid-November, there was no negative divergence with price (both Pzo and price were making similar lower and higher closes) so Dia would have been held through this period.
On 12/14/2009 to 12/15/2009, Pzo fell from above +40 to below +40. Dia also made a lower close so there was no negative divergence. On 12/16, Dia closed only a few cents lower but Pzo closed considerably lower, creating a negative divergence and a sell signal. An end-of-day close exited the trade at 104.41, for a gain of 9.09% before trading costs.
Dia subsequently climbed to a closing high of 106.91 on 1/19/2010. Does that mean the December exit left 2.4% of the trend on the table? No, because there was a second bite of the apple on 12/24/2009 when Pzo rose from below zero to above +15. An end-of-the-day entry bought Dia at 104.77.
On 1/19/2010 there was a clear negative divergence between price (higher close) and Pzo (lower close), which signaled an exit to the trade at the closing price of 106.91, for a gain of 2.04% before trading costs. Coincidentally, that marked the end of the uptrend because a few days later price closed below the 60-day Ema.
Good job on looking for a divergence between Vzo and Pzo. Sounds like you have a good understanding of how to use the oscillators.
Here again is the TradeStation Easy�Language code I use for the Vzo and Pzo indicators:
For the Vzo:
Input: Period(14);
  �Vars: MV(0), R(0), VP(0), TV(0), VZO(0);
  �
  MV = iff(DataCompression >= 2, AbsValue(Volume),Ticks);
  R = Sign(Close - Close[1]) * MV;
  VP = XAverage(R, Period);
  TV = Xaverage(MV, Period);
  �
  if TV <> 0 then VZO = 100 * VP / TV;
  �
  Plot1(VZO, "VZO");
  Plot2(+60, "+60");
  Plot3(+40, "+40");
  Plot4(+15, "+15");
  Plot5(-5,� "-5");
  Plot6(-40, "-40");
  Plot7(-60, "-60");
  Plot99(0, "zero");
  �
For the Pzo:
Input:Period(14);
Vars: MV(0), R(0), VP(0), TV(0), PZO(0);
�
MV = iff(DataCompression >= 2, AbsValue(Close), Ticks);
R = Sign(Close - Close[1]) * MV;
VP = XAverage(R, Period);
TV = Xaverage(MV, Period);
�
if TV <> 0 then PZO = 100 * VP / TV;
�
Plot1(PZO, "PZO");
Plot2(+60, "+60");
Plot3(+40, "+40");
Plot4(+15, "+15");
Plot5(-5, "-5");
Plot6(-40, "-40");
Plot7(-60, "-60");
Plot99(0, "zero");
If you have any additional questions, please don’t hesitate to write.
NEURAL NETWORK PAIR TRADING
 Editor,
I was reading “Neural Network Pair Trading” by Marge Sherald (Stocks & Commodities, February 2010) from the free article section of your website.
It is my understanding that the neural network has one input, zero hidden neurons, and a single output. In effect, the article uses a neural network to find the multiplier to align one stock with another.
Many people do not like to use neural networks because of their complexity or because they essentially rely on random numbers, causing them to produce different results each time they are trained. However, this problem can actually be easily solved to obtain the exact multiplier rather than the approximate multiplier found by a neural network. This can be done through linear regression. Depending on the capabilities of the software you use, most standard regression algorithms require that you have an extra term. For example, for this problem, the best you could do is stock_A * multiplier + extra_term = stock_B. However, we just want a multiplier, and this can be easily found as follows.
Let’s call the independent stock A and the dependent stock B. To find the multiplier M, first take the square of all the prices in A, and then sum them together, calling this value C. Next, multiply each price of B by its adjacent price in A, and then sum all these together and call this D. M is then D divided by C. In column-vector notation this is:
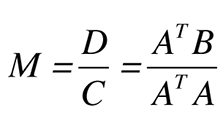
This is the linear regression algorithm adjusted for this problem. This value for M is the exact M according to the minimum mean squared error, which I believe is the standard error measure used by neural networks, and I assume is the one used in Sherald’s article.
To pick which stock pair to use, just calculate M and calculate the error between A*M and B. The pair with the lowest error is the pair to use.
The advantages of this method are:
- No training time
- Same result every time
- Fast algorithm (just a bunch of multiplication and a division)
- Not so complicated as to scare away everyday investors.
I’m sure it’s easy to see the first and last two advantages. The second one is an advantage because it now means better decisions can be made, as we can be ensured that the results we get are not the result of the neural network falling into the global minimum by chance, but is in fact the global minimum. Also, when calculating probability functions based on a trading system, you would normally have to consider the variability of the underlying model such as a neural network; however, there is no variability with an exact solution.
I should note that the network configuration that Sherald employed in the article is capable of finding the global minimum because it only has one parameter to optimize, which is a convex problem. However, the success on this then relates to the training parameters of the training algorithm and the amount of time spent training. Even then, the absolute exact solution may not be found but a very close value.
Adrian Letchford
Author Marge Sherald replies:
The NeuroShell Trader neural network I used in the article allows you to specify zero hidden neurons, which produces the same internal equation as linear regression. The advantage of using the neural network in NeuroShell Trader allowed me to also use the optimizer to select one side of the pairs trade from among several different stocks (for example, Pepco and Southern Co.). I didn’t have to run through multiple trials to find the correct stock to pair with Consolidated Edison, the stock I was predicting.
In one pass through the model, the optimizer chose Pepco as the best stock to use to predict Consolidated Edison. The nets trained in less than a second, and the optimizer selection took a little longer. The results are reproducible with the same dataset because our advanced nets do not depend on random numbers. I then took those results and built a trading system in NeuroShell Trader that produced simultaneous buy/sell signals that could be sent to a broker.