TRADERS’ TIPS
September 2011
Here is this month’s selection of Traders’ Tips, contributed by various developers of technical analysis software to help readers more easily implement some of the strategies presented in this and other issues.
The code on this webpage represents the efforts of third party software developers to program the formulas described by Andrew Coles, Ph.D, in the article “TD Sequential And Ermanometry for Intraday Traders,” published in the September 2011 issue of Technical Analysis of Stocks & Commodities. The code that reflects Dr. Coles’s interpretation of the TD Sequential Indicator is referred to below as “September 2011 Traders’ Tips Article Code.”
Other code appearing in articles in this issue is posted in the Subscriber Area of our website at https://technical.traders.com/sub/sublogin.asp. Login requires your last name and subscription number (from mailing label). Once logged in, scroll down to beneath the “Optimized trading systems” area until you see “Code from articles.” From there, code can be copied and pasted into the appropriate technical analysis program so that no retyping of code is required for subscribers.
You can copy these formulas and programs for easy use in your spreadsheet or analysis software. Simply “select” the desired text by highlighting as you would in any word processing program, then use your standard key command for copy or choose “copy” from the browser menu. The copied text can then be “pasted” into any open spreadsheet or other software by selecting an insertion point and executing a paste command. By toggling back and forth between an application window and the open web page, data can be transferred with ease.
This month’s tips include formulas and programs for:
- eSIGNAL
- WEALTH-LAB
- AMIBROKER
- NEUROSHELL TRADER
- AIQ
- TRADERSSTUDIO
- STRATASEARCH
- TRADECISION
- NINJATRADER
- UPDATA
- TRADESIGNAL
- CHARTSY
- TRADE NAVIGATOR
- VT TRADER
- MICROSOFT EXCEL
- METASTOCK
- BLOOMBERG
The computer code published on this webpage and in the September 2011 issue of this publication reflects the efforts of third parties to code the indicators discussed in the following article, published in the September 2011 issue of Technical Analysis of Stocks & Commodities: Andrew Coles, ‘TD Sequential and Ermanometry for Intraday Traders.’ The code published on this webpage or in the September 2011 issue of Stocks & Commodities is not sponsored or endorsed by, nor affiliated in any manner whatsoever with, Thomas DeMark or his company, Market Studies LLC, and it should not be confused with any indicator, software, product or service that he or his company may offer, or license others to offer, for purchase or licensing.

eSIGNAL: SEPTEMBER 2011
For this month’s Traders’ Tip, we’ve provided eSignal formulas based on Andrew Coles’ article in this issue.
The Ermanometry study (Figure 2) contains formula parameters to set the start date, start time, first wave period, and second wave period with options to show the Erman segments and Coles segments, which may be configured through the Edit Chart window. This September 2011 Traders’ Tips Article Code (Figure 3) also contains formula parameters to configure the price source, period, exhaustion period, buy setup, and sell setup colors.
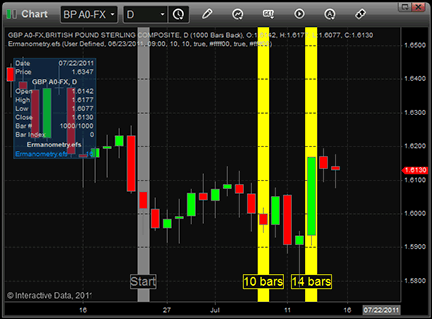
Figure 2: eSIGNAL, September 2011 Traders’ Tips Article Code
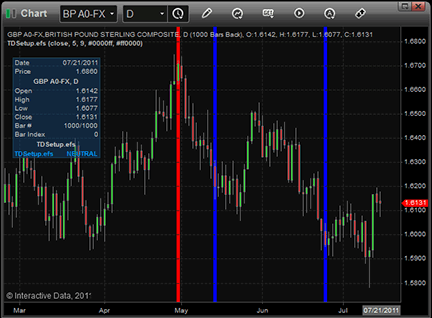
Figure 3: eSIGNAL, Ermanometry STUDY
To discuss this study or download a complete copy of the formula code, visit the Efs Library Discussion Board forum under the Forums link from the support menu at www.esignal.com, or visit our Efs KnowledgeBase at www.esignal.com/support/kb/efs/. The eSignal formula scripts (Efs) are also shown here for copying and pasting, and can can be downloaded here: Ermanometry.efs and September 2011 Traders’ Tips Article Code.efs.
"Ermanometry.efs"

/*********************************
Provided By:
    Interactive Data Corporation (Copyright © 2010)
    All rights reserved. This sample eSignal Formula Script (EFS)
    is for educational purposes only. Interactive Data Corporation
    reserves the right to modify and overwrite this EFS file with
    each new release.

Description:
    Ermanometry For Intraday Traders

Version:            1.00  14/06/2010

Formula Parameters:                     Default:
Select Start Date                       First Bar On Chart
Start Date (mm/dd/yyyy)
Start Time                              00:00
The First Wave Period                   10
The Second Wave Period                  10
Show Erman Segments                     true
Erman Segments Color                    Color.yellow
Show Coles Segments                     true
Colse Segments Color                    Color.yellow

Notes:
    The related article is copyrighted material. If you are not a subscriber
    of Stocks & Commodities, please visit www.traders.com.

**********************************/

var bVersion = null;
var fpArray = new Array();
function preMain()
{
    setPriceStudy(true);
    setPlotType(PLOTTYPE_FLATLINES);

    var x = 0;
    fpArray[x] = new FunctionParameter("gFirstBar", FunctionParameter.STRING);
    with(fpArray[x++]){
        setName("Select Start Date");
        addOption("First Bar On Chart");
        addOption("User Defined");
        setDefault("First Bar On Chart");
    }

    fpArray[x] = new FunctionParameter("gStartDate", FunctionParameter.STRING);
    with (fpArray[x++])
    {
        setName("Start Date (mm/dd/yyyy)" );
        setDefault("");
    }

    fpArray[x] = new FunctionParameter("gStartTime", FunctionParameter.STRING);
    with (fpArray[x++])
    {
        setName("Start Time (hh:mm)" );
        setDefault("00:00");
    }

    fpArray[x] = new FunctionParameter("gWave1", FunctionParameter.INTEGER);
    with (fpArray[x++])
    {
        setName("The First Wave Period" );
        setLowerLimit(1);
        setDefault(10);
    }

    fpArray[x] = new FunctionParameter("gWave2", FunctionParameter.INTEGER);
    with (fpArray[x++])
    {
        setName("The Second Wave Period" );
        setLowerLimit(1);
        setDefault(10);
    }

    fpArray[x] = new FunctionParameter("gErman", FunctionParameter.BOOLEAN);
    with (fpArray[x++])
    {
        setName("Show Erman Segments");
        setDefault(true);
    }

    fpArray[x] = new FunctionParameter("gErmanColor", FunctionParameter.COLOR);
    with (fpArray[x++])
    {
        setName("Erman Segments Color");
        setDefault(Color. yellow);
    }

    fpArray[x] = new FunctionParameter("gColes", FunctionParameter.BOOLEAN);
    with (fpArray[x++])
    {
        setName("Show Coles Segments");
        setDefault(true);
    }

    fpArray[x] = new FunctionParameter("gColesColor", FunctionParameter.COLOR);
    with (fpArray[x++])
    {
        setName("Coles Segments Color");
        setDefault(Color. yellow);
    }
}

var bInit = false;
var nRatio = 0;
var arrLogSpiral = new Array();
var arrErmanVal = null;
var arrColesVal = null;
var arrColesSign = new Array();
var cFixColor = null;
var startPos = 0;
var i = 0;
var offsetBar = null;
function main(gFirstBar, gStartDate, gStartTime, gWave1, gWave2, gErman, gErmanColor, gColes, gColesColor)
{
    if (bVersion == null) bVersion = verify();
    if (bVersion == false) return;

    var retVal = null;

    if (getCurrentBarIndex() == 0 && getBarState() == BARSTATE_CURRENTBAR && cFixColor!=null) setBarBgColor(cFixColor);


    if (!bInit)
    {
        nRatio = gWave2 / gWave1;

        for (i = 0; i<=8; i++) arrLogSpiral[i] = Math.round( gWave1*Math.pow(nRatio, i-3) );
        arrLogSpiral[9] = Math.round( Math.sqrt(Math.pow(arrLogSpiral[7],2)+Math.pow(arrLogSpiral[8],2)) );
        arrLogSpiral[10] = Math.round( Math.sqrt(Math.pow(arrLogSpiral[2],2)+Math.pow(arrLogSpiral[3],2)) );
        arrLogSpiral[11] = Math.round( Math.sqrt(Math.pow(arrLogSpiral[4],2)+Math.pow(arrLogSpiral[5],2)) );

        arrErmanVal = new Array(
                                    arrLogSpiral[9], //FH
                                    arrLogSpiral[6], //GH
                                    arrLogSpiral[7], //HI
                                    arrLogSpiral[8], //IJ
                                    arrLogSpiral[3]+arrLogSpiral[4]+arrLogSpiral[2], //DE+EF+CD
                                    arrLogSpiral[6]+arrLogSpiral[7]+arrLogSpiral[8], //GH+HI+IJ
                                    arrLogSpiral[2]+arrLogSpiral[3]+arrLogSpiral[4]+arrLogSpiral[5]+arrLogSpiral[6]+arrLogSpiral[7], //CD+DE+EF+FG+GH+HI
                                    arrLogSpiral[4]+arrLogSpiral[5]+arrLogSpiral[6], //EF+FG+GH
                                    arrLogSpiral[2]+arrLogSpiral[3]+arrLogSpiral[4]+arrLogSpiral[5]+arrLogSpiral[6], //CD+DE+EF+FG+GH
                                    arrLogSpiral[6]+arrLogSpiral[8]+arrLogSpiral[2]+arrLogSpiral[0]+arrLogSpiral[4] //GH+IJ+CD+AB+EF
        );
        arrColesVal = new Array(
                                    arrLogSpiral[9]+arrLogSpiral[5]+arrLogSpiral[6], //FH+FG+GH
                                    arrLogSpiral[0]+arrLogSpiral[1]+arrLogSpiral[2]+arrLogSpiral[3], //AB+BC+CD+DE
                                    arrLogSpiral[0]+arrLogSpiral[1]+arrLogSpiral[2]+arrLogSpiral[3]+arrLogSpiral[6], //AB+BC+CD+DE+GH
                                    arrLogSpiral[5]+arrLogSpiral[6], //FG+GH
                                    arrLogSpiral[6]+arrLogSpiral[7], //GH+HI
                                    arrLogSpiral[5]+arrLogSpiral[1]+arrLogSpiral[2], //FG+BC+CD
                                    arrLogSpiral[5]+arrLogSpiral[1]+arrLogSpiral[2]+arrLogSpiral[3], //FG+BC+CD+DE
                                    arrLogSpiral[2]+arrLogSpiral[1], //CD+BC
                                    arrLogSpiral[3]+arrLogSpiral[1], //DE+BC
                                    arrLogSpiral[10]+arrLogSpiral[2]+arrLogSpiral[3], //CE+CD+DE
                                    arrLogSpiral[11]+arrLogSpiral[4]+arrLogSpiral[5] //EG+EF+FG
        );


        bInit = true;
    }

    if ( getBarState() == BARSTATE_ALLBARS )
    {
        offsetBar = null;
        if ( gFirstBar !=  "User Defined" )  offsetBar = 0;
        else
        {
            var xDate = gStartDate.split("/");
            var xTime = (!isDWM()) ? gStartTime.split(":") : new Array("0","0");
            var startDate = new Date(xDate[2], xDate[0], xDate[1], xTime[0], xTime[1]);
            startPos = startDate.getTime();
        }

        if (offsetBar == 0)
        {
                setBarBgColor(Color.grey);
                drawTextRelative(0, BottomRow2, "Start" , Color.grey, null, Text.FRAME | Text.PRESET | Text.CENTER , "Arial", 11, "Start" );
                retVal = "START";
        }
    }

    if ( getBarState() == BARSTATE_NEWBAR )
    {
        if ( isNull(offsetBar) )
        {
            var currentDate = new Date(year(0), month(0), day(0), hour(0), minute(0));
            var currentPos = currentDate.getTime();
            if ( currentPos == startPos )
            {
                offsetBar = Math.abs(getOldestBarIndex() - getCurrentBarIndex());
                setBarBgColor(Color.grey);
                drawTextRelative(0, BottomRow2, "Start" , Color.grey, null, Text.FRAME | Text.PRESET | Text.CENTER , "Arial", 11, "Start" );
                retVal = "START";
            }
            if  ( currentPos > startPos  )
            {
                drawTextRelative(1, 20, " Date not availible ", Color.grey, null, Text.RELATIVETOLEFT|Text.RELATIVETOBOTTOM|Text.BOLD|Text.LEFT|Text.FRAME, null, 12, "dna");
                retVal = "Date Not Availible";
            }
        }

        else
        {

            var segE = 0;
            var segC = 0;
            for (i=0; i<=9; i++) if ( -getOldestBarIndex()-offsetBar-arrErmanVal[i]  == -getCurrentBarIndex() && gErman ) segE = arrErmanVal[i];
            for (i=0; i<=10; i++) if ( -getOldestBarIndex()-offsetBar-arrColesVal[i]  == -getCurrentBarIndex() && gColes ) segC = arrColesVal[i];

            if ( segE !=0 )
            {
                cFixColor = gErmanColor;
                setBarBgColor(gErmanColor);
                drawTextRelative(0, BottomRow2, segE+ " bars" , gErmanColor, null, Text.FRAME | Text.PRESET | Text.CENTER , "Arial", 11, segE );
                retVal = ""+segE;
            }
            else if (segC !=0 )
            {
                cFixColor = gColesColor;
                setBarBgColor(gColesColor);
                drawTextRelative(0, BottomRow2, segC+ " bars" , gColesColor, null, Text.FRAME | Text.PRESET | Text.CENTER , "Arial", 11, segC );
                retVal = ""+segC;
            }
            else
            {
                cFixColor = null;
                var fromStart = -getOldestBarIndex()-offsetBar + getCurrentBarIndex();
                retVal = ""+fromStart;
            }
        }
    }

    return retVal;
}

function verify() {
    var b = false;
    if (getBuildNumber() < 779) {
        drawTextAbsolute(5, 35, "This study requires version 8.0 or later.",
            Color.white, Color.blue, Text.RELATIVETOBOTTOM|Text.RELATIVETOLEFT|Text.BOLD|Text.LEFT,
            null, 13, "error");
        drawTextAbsolute(5, 20, "Click HERE to upgrade.@URL=https://www.esignal.com/download/default.asp",
            Color.white, Color.blue, Text.RELATIVETOBOTTOM|Text.RELATIVETOLEFT|Text.BOLD|Text.LEFT,
            null, 13, "upgrade");
        return b;
    } else {
        b = true;
    }
    return b;
}


"September 2011 Traders' Tips Article Code.efs"

/*********************************
Provided By:
    Interactive Data Corporation (Copyright © 2010)
    All rights reserved. This sample eSignal Formula Script (EFS)
    is for educational purposes only. Interactive Data Corporation
    reserves the right to modify and overwrite this EFS file with
    each new release.

Description:
    TradersSeptember 2011 Traders' Tips Article Code (Andrew Coles article, September 2011 issue,
Technical Analysis of Stocks and Commodities)

Version:            1.00  14/06/2010

Formula Parameters:                     Default:
Price Source                            close
Period                                  5
Exhaustion Period                       9
Buy Setup Color                         Color.blue
Sell Setup Color                        Color.red

Notes:
    The related article is copyrighted material. If you are not a subscriber
    of Stocks & Commodities, please visit www.traders.com.

**********************************/
var bVersion = null;
var fpArray = new Array();
function preMain()
{
    setPriceStudy(true);
    setPlotType(PLOTTYPE_FLATLINES);

    var x = 0;
    fpArray[x] = new FunctionParameter("gPS", FunctionParameter.STRING);
    with (fpArray[x++])
    {
        setName("Price Source");
        addOption("open");
        addOption("close");
        addOption("high");
        addOption("low");
        addOption("hl2");
        addOption("hlc3");
        addOption("ohlc4");
        setDefault("close");
    }

    fpArray[x] = new FunctionParameter("gPeriod", FunctionParameter.INTEGER);
    with (fpArray[x++])
    {
        setName("Period");
        setDefault(5);
    }

    fpArray[x] = new FunctionParameter("gExhaustion", FunctionParameter.INTEGER);
    with (fpArray[x++])
    {
        setName("Exhaustion Period");
        setDefault(9);
    }

    fpArray[x] = new FunctionParameter("gBuyColor", FunctionParameter.COLOR);
    with (fpArray[x++])
    {
        setName("Buy Setup Color");
        setDefault(Color.blue);
    }

    fpArray[x] = new FunctionParameter("gSellColor", FunctionParameter.COLOR);
    with (fpArray[x++])
    {
        setName("Sell Setup Color");
        setDefault(Color.red);
    }


}

var bInit = false;
var xSrc = null;
var xMom = null;
var xHH = null;
var xLL = null;
var counter = 0;
function main(gPS, gPeriod, gExhaustion, gBuyColor, gSellColor)
{
    if (bVersion == null) bVersion = verify();
    if (bVersion == false) return;

    if ( !bInit )
    {
        switch (gPS)
        {
            case "Open"||"O": xSrc = open(); break;
            case "High"||"H": xSrc = high(); break;
            case "Low"||"L" : xSrc = low();  break;
            case "hl2"||"hl/2" : xSrc = hl2(); break;
            case "hlc3"||"hlc/3" : xSrc = hlc3(); break;
            case "ohlc4"||"ohlc/4" : xSrc = ohlc4(); break;
            default : xSrc = close();
        }
        xMom = mom(gPeriod, xSrc);
        xHH = hhv(gExhaustion, xMom);
        xLL = llv(gExhaustion, xMom);
        bInit = true;
    }
    var vHH = xHH.getValue(0);
    var vLL = xLL.getValue(0);
    var vFlip = xMom.getValue(-gExhaustion);
    if ( xHH.getValue(0) == null ) return null;


    var retValue = "NEUTRAL";
    if ( vHH <= 0 && vFlip >= 0 )
    {
        setBarBgColor(gBuyColor);
        retValue = "BUY SETUP";
    }
    if ( vLL > 0 && vFlip <= 0 )
    {
        setBarBgColor(gSellColor);
        retValue = "SELL SETUP";
    }


    return  retValue;
}


function verify() {
    var b = false;
    if (getBuildNumber() < 779) {
        drawTextAbsolute(5, 35, "This study requires version 8.0 or later.",
            Color.white, Color.blue, Text.RELATIVETOBOTTOM|Text.RELATIVETOLEFT|Text.BOLD|Text.LEFT,
            null, 13, "error");
        drawTextAbsolute(5, 20, "Click HERE to upgrade.@URL=https://www.esignal.com/download/default.asp",
            Color.white, Color.blue, Text.RELATIVETOBOTTOM|Text.RELATIVETOLEFT|Text.BOLD|Text.LEFT,
            null, 13, "upgrade");
        return b;
    } else {
        b = true;
    }
    return b;
}

WEALTH-LAB: SEPTEMBER 2011
The Wealth-Lab code for the time-based Ermanometry system described by Andrew Coles in his article in the September 2011 issue is available for instant download from Wealth-Lab’s “Open strategy” dialog. The code is also shown below.
Users should be aware that with methods without a rock-solid starting point, it’s an open question as to whether automatic line placement on the chart removes the subjectivity. And one thing’s for sure: If you draw enough lines on a chart, some of them are bound to hit important turning points.
A sample chart is shown in Figure 4.
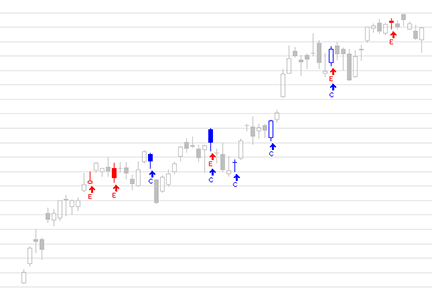
Figure 4: WEALTH-LAB, ERMANOMETRY. Here is a sample Wealth-Lab Developer 6.2 chart showing the Ermanometry/Coles barchart markup applied to a daily chart. The Erman bars are red and the Coles series are blue.
_TD_Seq_Setup (Indicator)

{ TASC Article, September 2011 }
{ Tom DeMark TD Sequential Setup }

inputs:
	Price( Close ),
	DotOffsetTicks( 5 ) ;

variables:
	MyTick( MinMove / PriceScale ),
	LongCount( 0 ),
	ShortCount( 0 ) ;

LongCount = Iff( Price < Price[4], LongCount + 1, 0 ) ;
ShortCount = Iff( Price > Price[4],
 ShortCount + 1, 0 ) ;

{ Buy Setup }
if LongCount = 9 and Price[9] > Price[13] then
	Plot1( L - DotOffsetTicks * MyTick, "TD Buy SU" )
else
	NoPlot( 1 ) ;

{ Sell Setup }
if ShortCount = 9 and Price[9] < Price[13] then
	Plot2( H + DotOffsetTicks * MyTick, "TD Sell SU" )
else
	NoPlot( 2 ) ;


_Ermanometry (Indicator)

{ TASC Article, September 2011 }
{ Ermanometry - William Erman }

inputs:
	StartBarDate( 1110101 ), { EasyLanguage bar Date
	 for start bar }
	StartBarTime( 0900 ), { EasyLanguage bar Time for
	 start bar }
	EF( 1 ), { number of bars of first leg }
	DE( 1 ), { number of bars of second leg }
	PlotColes( true ), { include plots for Coles
	 additions }
	DotOffsetTicks( 5 ) ;

variables:
	MyTick( MinMove / PriceScale ),
	StartBar( 0 ),
	X( 0 ),
	Ratio( 0 ),
	InverseRatio( 0 ),
	CD( 0 ),
	BC( 0 ),
	AB( 0 ),
	FG( 0 ),
	GH( 0 ),
	HI( 0 ),
	IJ( 0 ),
	FH( 0 ) ;

if Date = StartBarDate and Time = StartBarTime then
	StartBar = CurrentBar ;

X = Iff( StartBar > 0, CurrentBar - StartBar, 0 ) ;

if DE > 0 then
	Ratio = EF / DE ;

if Ratio > 0 then
	InverseRatio = 1 / Ratio ;

CD = DE * InverseRatio ;
BC = CD * InverseRatio ;
AB = BC * InverseRatio ;
FG = EF * Ratio ;
GH = FG * Ratio ;
HI = GH * Ratio ;
IJ = HI * Ratio ;

FH = SquareRoot( Power( FG, 2 ) + Power( GH, 2 ) ) ;

{ Erman }
Condition1 = X = IntPortion( FH ) ;
Condition2 = X = IntPortion( GH ) ;
Condition3 = X = IntPortion( HI ) ;
Condition4 = X = IntPortion( IJ ) ;
Condition5 = X = IntPortion( DE + EF + CD ) ;
Condition6 = X = IntPortion( GH + HI + IJ ) ;
Condition7 = X =
 IntPortion( CD + DE + EF + FG + GH + HI ) ;
Condition8 = X = IntPortion( EF + FG + GH ) ;
Condition9 = X = IntPortion( CD + DE + EF + FG + GH ) ;
Condition10 = X =
 IntPortion( CD + DE + EF + FG + GH + HI ) ;
Condition11 = X =
 IntPortion( GH + IJ + CD + AB + EF ) ;

{ Coles }
Condition12 = X = IntPortion( FH + FG + GH ) ;
Condition13 = X = IntPortion( AB + BC + CD + DE ) ;
Condition14 = X =
 IntPortion( AB + BC + CD + DE + GH ) ;
Condition15 = X = IntPortion( FG + GH ) ;
Condition16 = X = IntPortion( GH + HI ) ;
Condition17 = X = IntPortion( FG + BC + CD ) ;
Condition18 = X = IntPortion( FG + BC + CD + DE ) ;
Condition19 = X = IntPortion( CD + BC ) ;
Condition20 = X = IntPortion( DE + BC ) ;
Condition21 = X = IntPortion( SquareRoot( Power(CD, 2)
 + Power( DE, 2 ) ) + CD + DE ) ;
Condition22 = X = IntPortion( SquareRoot( Power(EF, 2)
 + Power( FG, 2 ) )+ EF + FG ) ;

{ Erman Condition }
Condition23 = Condition1 or Condition2 or Condition3
 or Condition4 or Condition5 or Condition6 or
 Condition7 or Condition8 or Condition9 or
 Condition10 or Condition11 ;

{ Coles Condition }
Condition24 = Condition12 or Condition13 or Condition14
 or Condition15 or Condition16 or Condition17 or
 Condition18 or Condition19 or Condition20 or
 Condition21 or Condition22 ;

if Condition23 or ( PlotColes and Condition24 )
 and StartBar > 0 then
	Plot1( L - DotOffsetTicks * MyTick, "Ermanometry" )
else
	NoPlot( 1 ) ;

AMIBROKER: SEPTEMBER 2011
In this issue, author Andrew Coles presents two timing techniques. A ready-to-use September 2011 Traders’ Tips Article Code for AmiBroker is presented in Listing 1, and the formula for Ermanometry is presented in Listing 2 below. To use the formulas, enter them in the Afl editor, then press “insert indicator.” The starting point of a time series for Ermanometry can be selected either by a mouse-click or by using the parameter window to change the lengths of seed segments.
A sample chart is shown in Figure 5.
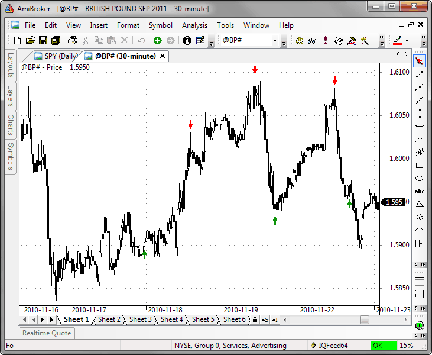
Figure 5: AMIBROKER, SEPTEMBER 2011 TRADERS’ TIPS ARTICLE CODE. Here is a 30-minute British pound futures chart with a September 2011 Traders’ Tips Article Code buy (green) and sell (red) example.
LISTING 1
// TD Sequential Setup
Plot( C, "Price", colorBlack, styleCandle );
y = ParamField("Price field");

Buy = Sum( y < Ref( y, -4 ), 9 ) == 9 AND Ref( y, -9) > Ref( y, -13 );
Sell = Sum( y > Ref( y, -4 ), 9 ) == 9 AND Ref( y, -9) < Ref( y, -13 );

PlotShapes( Buy * shapeUpArrow + Sell * shapeDownArrow, IIf( Buy, colorGreen, colorRed ), 0, IIf( Buy, L, H ) );


LISTING 2
// Ermanometry
Plot( C, "Price", colorBlack, styleCandle );
dt = DateTime();
Start = dt == SelectedValue( dt );

EF = Param("Seed Seg EF", 48, 1, 900 );
DE = Param("Seed Seg DE", 40, 1, 900 );

Ratio = EF/DE;
InverseRatio = 1/Ratio;

x = BarsSince( start );
CD = DE * Inverseratio;
BC = CD * Inverseratio;
AB = BC * Inverseratio;
FG = EF* Ratio;
GH = FG * Ratio;
HI = GH * Ratio;
IJ = HI * Ratio;

FH = sqrt( FG ∧ 2 + GH ∧ 2 );

Erman =
x == int(FH) OR /* Erman */
x == int(GH) OR /* Erman */
x == int(HI) OR /* Erman */
x == int(IJ) OR /* Erman */
x == int(DE+EF+CD) OR /* Erman */
x == int(GH+HI+IJ) OR /* Erman */
x == int(CD+DE+EF+FG+GH+HI) OR /* Erman */
x == int(EF+FG+GH) OR /* Erman */
x == int(CD+DE+EF+FG+GH) OR /* Erman */
x == int(CD+DE+EF+FG+GH+HI) OR /* Erman */
x == int(GH+IJ+CD+AB+EF); /* Erman */

Plot( Erman, "Erman", colorRed, styleHistogram | styleOwnScale );

FH = sqrt( FG ∧ 2 + GH ∧ 2 );

Coles =
x == int(FH+FG+GH) OR /* Coles */
x == int(AB+BC+CD+DE) OR /* Coles */
x == int(AB+BC+CD+DE+GH) OR /* Coles */
x == int(FG+GH) OR /* Coles */
x == int(GH+HI) OR /* Coles */
x == int(FG+BC+CD) OR /* Coles */
x == int(FG+BC+CD+DE) OR /* Coles */
x == int(CD+BC) OR /* Coles */
x == int(DE+BC) OR /* Coles */
x == int(sqrt(CD∧2+DE∧2)+CD+DE) OR /* Coles */
x == int(sqrt(EF∧2+FG∧2)+EF+FG); /* Coles */

Plot( Coles, "Coles", colorGreen, styleHistogram | styleOwnScale );

NEUROSHELL TRADER: SEPTEMBER 2011
The indicators described by Andrew Coles in his article in this issue can be easily implemented with a few of NeuroShell Trader’s 800+ indicators. Select “New Indicator” from the Insert menu and use the indicator wizard to recreate the following indicators:
TD BuySetup:
AND2( A=B( Sum( A<B(Price, Lag(Price,4) ), 9), 9), A>B( Lag(Price,9), Lag(Price,13) ) )

TD Sell Setup:
AND2( A=B( Sum( A>B(Price, Lag(Price,4) ), 9), 9), A<B( Lag(Price,9), Lag(Price,13) ) )

Ratio: 	Divide( EF, DE )
InverseRatio: Divide( 1, Divide( EF, DE ) )
CD:  	Multiply2( DE, InverseRatio )
BC:  	Multiply2( CD, InverseRatio )
AB:  	Multiply2( BC, InverseRatio )
FG:  	Multiply2( EF, Ratio )
GH:  	Multiply2( FG, Ratio )
HI:  	Multiply2( GH, Ratio )
IJ:  	Multiply2( HI, Ratio )
FH:  	SqrRt( Add2( Power(FG,2), Power(GH,2) ) )
BarsSince: BarsSinceCond( And2( DateIS(Year, Month, Day), TimeIS(Hour, Minute, Second, 0.25)))

Ermanometry Series Time Target: Or2(Or4(Or4(A=B(BarsSince,Quotient(FH,1)),A=B(BarsSince,Quotient(GH,1)),A=B(BarsSince,Quotient(HI,1)),A=B(BarsSince,Quotient(IJ,1))),Or4(A=B(BarsSince,Quotient(Add3(DE,EF,CD),1)),A=B(BarsSince,Quotient(Add3(GH,HI,IJ),1)),A=B(BarsSince,Quotient(Add2(Add3(CD,DE,EF),Add3(FG,GH,HI)),1)),A=B(BarsSince,Quotient(Add3(EF,FG,GH),1))),Or4(A=B(BarsSince,Quotient(Add2(CD,Add4(DE,EF,FG,GH))),1)),A=B(BarsSince,Quotient(Add3(CD,DE,Add4(EF,FG,GH,HI))),1)),A=B(BarsSince,Quotient(Add2(GH,Add4(IJ,CD,AB,EF)),1)),A=B(BarsSince,Quotient(Add3(FH,FG,GH),1))),Or4(A=B(BarsSince,Quotient(Add4(AB,BC,CD,DE),1)),A=B(BarsSince,Quotient(Add2(AB,Add4(BC,CD,DE,GH))),1)),A=B(BarsSince,Quotient(Add2(FG,GH),1)),A=B(BarsSince,Quotient(Add2(GH,HI),1))),),Or3(Or4(A=B(BarsSince,Quotient(Add3(FG,BC,CD),1)),A=B(BarsSince,Quotient(Add4(FG,BC,CD,DE)),1)),A=B(BarsSince,Quotient(Add2(CD,BC),1)),A=B(BarsSince,Quotient(Add2(DE,BC),1))),A=B(BarsSince,Quotient(Add3(SqrRt(Add2(Power(CD,2),Power(DE,2))),CD,DE),1)),A=B(BarsSince,Quotient(Add3(SqrRt(Add2(Power(EF,2),Power(FG,2))),EF,FG),1))))
Note that the BarsSinceCond indicator is found in the Advanced Indicator Set 2 add-on, while the DateIs and TimeIs indicators are found in the Advanced Indicator Set 3 add-ons.
Users of NeuroShell Trader can go to the Stocks & Commodities section of the NeuroShell Trader free technical support website to download a copy of this or any previous Traders’ Tips.
A sample chart is shown in Figure 6.
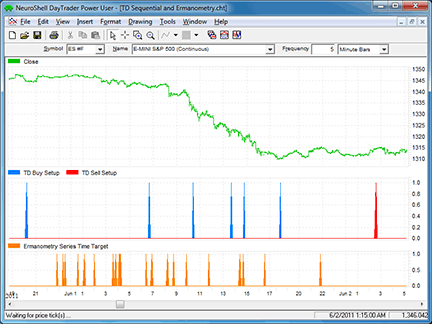
Figure 6: NEUROSHELL TRADER. This sample NeuroShell Trader chart shows the indicators reviewed in the September 2011 issue by Andrew Coles, Ph.D.

AIQ: MONEY FLOW INDICATORS
For this month’s Traders’ Tip, I will provide Aiq code based the July 2011 article by Markos Katsanos, “Comparing Seven Money Flow Indicators.”
The amount of code that I have converted is quite extensive and includes the seven money flow indicators as well as the code for the 14 systems that Katsanos used to make comparative tests of the seven indicators. All of the code and systems are set up as one Eds file, available for download from www.TradersEdgeSystems.com/traderstips.htm. The code is also shown here. Time did not permit me to run the comparative tests that were shown in the article.
! COMPARING SEVEN MONEY FLOW INDICATORS
! Author: Markos Katsanos, TASC July 2011
! Coded by: Richard Denning 7/17/2011
! www.TradersEdgeSystems.com


!Shown here is the AIQ code for the direction and divergence systems based
!on the seven money-flow indicators discussed in Markos Katsanos' article in the
!July 2011 issue of Technical Analysis of Stocks & Commodities, "Comparing Seven Money Flow Indicators."
!Here are some notes on the systems from author Markos Katsanos:
!The moving average period and money flow level parameters were optimized for each system.
!All systems are similar and use only money flow criteria except for the volume oscillator,
!which was used to confirm a price-based indicator.
!There is no need to create any additional functions because all necessary code for the money
!flow indicators is included in each system.
!If you wish to replicate the tests, keep in mind that for the test to begin producing signals,
!the indicators and linear regression should first be calculated, and this requires a number of
!bars to be loaded first and the test start date to be adjusted backwards.
!For all the following tests (except the VFI), I loaded 81 additional bars
!(21 bars for the money flow + 60 bars for the moving average calculation) and moved the test
!start date 81 trading days earlier to 07/07/2000, so that each test could start producing trades from 10/31/2000.


!MONEY FLOW DIRECTION SYSTEMS
!FVE direction test
!INPUTS:
MFPERIOD1 is 21.
MABUY1 is 60.
MASELL1 is 60.
FVEBUY1 is 10.
FVESELL1 is 0.
XTIME is 42.
SDBARS is 30.
PREV is 7.
SDCR1 is 0.5.

!FVE CALCULATION
TP is ([High] + [Low] + [Close])/3.
TP1 is valresult(TP,1).
INTRA1 is LN([High])-LN([Low]).
VINTRA1 is sqrt(variance(INTRA1,MFPERIOD1)).
INTER1 is LN(TP)- LN(TP1).
VINTER1 is sqrt(variance(INTER1,MFPERIOD1)).
CUTOFF1 is 0.1*VINTRA1 + 0.1*VINTER1.
MF1 is ([Close] - ([High] + [Low])/2)+ TP-TP1.
FveFactor1 is iff( MF1>CutOff1*[Close],1,iff(MF1<-1*CutOff1*[Close],-1,0)).
VolumePlusMinus1 is [Volume] * FveFactor1.
VA is simpleavg([Volume],MFPERIOD1).
FVEsum is Sum(VolumePlusMinus1,MFPERIOD1).
FVE is iff( VA<>0,(FVEsum /(VA*MFPERIOD1))*100,0).
avgFVE is simpleavg(FVE,MABUY1).
avgFVEsell is simpleavg(FVE,MASELL1).

!BUY
Setup1 if FVE > avgFVE and valrule(FVE < avgFVE,1) and FVE>FVEBUY1
	and FVE-valresult(FVE,PREV)> SDCR1*Sqrt(variance(FVE,SDBARS,1)).
!BUY("MA") NEXT BAR AT CLOSE+.05*C/100 STOP;
EntryPr is val([close],1)*(1+0.05/100).
BUY_FVE if valrule(Setup1,1) and [high] > EntryPr.

!SELL
SELL_FVE if (FVE < avgFVEsell and valrule(FVE >= avgFVEsell,1) and FVE < FVESELL1)
	or {position days} >= XTIME.

!VFI direction test
!INPUTs:
PERIOD2 is 130.
MABUY2 is 40.
MASELL2 is 30.
MFBUY2 is 0.
MFSELL2 is 0.
!SDBARS is 30.
!PREV is 7.
SDCR2 is 0.

! VFI CALCULATION
Inter2 is iff(TP<>0 and TP1<>0,Ln(TP) - Ln(TP1), 0).
VInter2 is sqrt(variance( Inter2, 30 )).
CutOff2 is 0.2 * VInter2 * [Close].
VAve2 is simpleavg([Volume],PERIOD2,1).
VMax2 is VAve2 * 2.5.
VC2 is iff([Volume] < VMax2 , [Volume], VMax2).
MF2 is TP - TP1.
DirectionalVolume2 is iff(MF2 > CutOff2, VC2, iff( MF2 < -CutOff2, -VC2, 0)).
VFI is iff(VAve2<>0,Sum(DirectionalVolume2, PERIOD2) / Vave2,0).
myVFI is expavg(VFI, 3).
avgVFI is simpleavg(myVFI,MABUY2).
avgVFIsell is simpleavg(myVFI,MASELL2).
!BUY
Setup2 if myVFI > avgVFI and valrule(myVFI <= avgVFI,1) and myVFI > MFBUY2
	and myVFI-valresult(myVFI,PREV) > SDCR2*sqrt(variance(myVFI,SDBARS,1)).
BUY_VFI if valrule(Setup2,1) and [high] > EntryPr.

!SELL
SELL_VFI if (myVFI < avgVFIsell and valrule(myVFI >= avgVFIsell,1) and myVFI < MFSELL2)
	or {position days} >= XTIME.

!CMF direction test
!INPUTS:
MFPERIOD3 is 21.
MABUY3 is 50.
MASELL3 is 40.
MFBUY3 is 5.
MFSELL3 is -5.
!XTIME is 42.
!SDBARS is 30.
!PREV is 7.
SDCR3 is 1.

!CMF CALCULATION
AccDist is iff( ([high] - [low])*[volume] <> 0,(([close]-[low])-([high]-[close])) / ([high] - [low]) * [volume],0).
CMF is sum(AccDist, MFPERIOD3) / sum([volume], MFPERIOD3)*100 .
avgCMF is simpleavg(CMF,MABUY3).
avgCMFsell is simpleavg(CMF,MASELL3).
!BUY
SetUp3 if CMF > avgCMF and valrule(CMF <= avgCMF,1) and CMF > MFBUY3
	AND CMF-valresult(CMF,PREV) > SDCR3*sqrt(variance(CMF,SDBARS,1)).
BUY_CMF if valrule(SetUp3,1) and [high] > EntryPr.

!EXIT
SELL_CMF if (CMF < avgCMFsell and valrule(CMF >= avgCMFsell,1) AND CMF < MFSELL3)
	or {position days} >= XTIME.

!MFI direction test
!INPUTS:
MFPERIOD4 is 21.
MABUY4 is 50.
MASELL4 is 30.
MFBUY4 is 50.
MFSELL4 is 60.
!XTIME is 42.
!PREV is 7.
SDCR4 is 1.

!MFI CALCULATION
PosMF is iff(TP > TP1,TP*[volume],0).
UpSum is Sum(PosMF,MFPERIOD4).
!DnSum is Sum(NegMF,MFPERIOD4).
MFI is UpSum/sum(TP*[volume],MFPERIOD4)*100.
avgMFI is simpleavg(MFI,MABUY4).
avgMFIsell is simpleavg(MFI,MASELL4).
!BUY
MFIr1 if MFI > avgMFI and valrule(MFI <= avgMFI,1).
MFIr2 if MFI > MFBUY4.
MFIr3 if MFI-valresult(MFI,PREV) > SDCR4*sqrt(variance(MFI,30,1)).
MFIr4 if [high] > EntryPr.
MFIdiff is MFI-valresult(MFI,PREV).
MFIvar is SDCR4*sqrt(variance(MFI,30,1)).
SetUp4 if MFI > avgMFI and valrule(MFI <= avgMFI,1) and MFI > MFBUY4
	and MFI-valresult(MFI,PREV) > SDCR4*sqrt(variance(MFI,30,1)).
BUY_MFI if valrule(SetUp4,1) and [high] > EntryPr.
!EXIT
SELL_MFI if (MFI < avgMFIsell and valrule(MFI >= avgMFIsell,1) and MFI < MFSELL4)
	or {position days} >= XTIME.

!OBV direction test

!INPUTS:
MABUY5 is 70.
MAFAST5 is 5.
MASELL5 is 30.
!XTIME is 42.
!PREV is 7.
SDCR5 is 0.5.

! OBV CALCULATION
HD is hasdatafor(252).
OBV is sum(iff([Close] > val([Close],1),[Volume],-[Volume]),HD).
avgOBV is simpleavg(OBV,MAFAST5).
avgOBVbuy is simpleavg(OBV,MABUY5).
avgOBVsell is simpleavg(OBV,MASELL5).
!BUY
SetUp5 if OBV > avgOBV and valrule(OBV <= avgOBV,1)
	and OBV-valresult(OBV,PREV) > SDCR5*sqrt(variance(OBV,30,1))
	and OBV > avgOBVbuy.
BUY_OBV if valrule(SetUp5,1) and [high] > EntryPr.
!SELL
SELL_OBV if OBV < avgOBVsell and valrule(OBV >= avgOBVsell,1)
	or {position days} >= XTIME.

!VPT direction test

!INPUTS:
MABUY6 is 60.
MAFAST6 is 5.
MASELL6 is 40.
!XTIME is 42.
!SDBARS is 30.
!PREV is 7.
SDCR6 is 1.5.

! VOLUME-PRICE TREND CALCULATION
VPT is sum([Volume]*([Close]/val([Close],1)-1),HD).
avgVPT is simpleavg(VPT,MAFAST6).
avgVPTbuy is simpleavg(VPT,MABUY6).
avgVPTsell is simpleavg(VPT,MASELL6).
!BUY
Setup6 if VPT > avgVPT and valrule(VPT <= avgVPT,1)
	and VPT-valresult(VPT,PREV)> SDCR6*sqrt(variance(VPT,SDBARS,1))
	and VPT>avgVPTbuy.
BUY_VPT if valrule(SetUp6,1) and [high] > EntryPr.
!SELL
SELL_VPT if VPT < avgVPTsell
	or {position days} >= XTIME.

!Volume oscillator direction test
!INPUTS:
MFBUY7 is 25.
MFSELL7 is 25.
!XTIME is 42.
FastLen7 is 5.
SlowLen7 is 21.
MAPRICE7 is 50.
MACSELL7 is 10.

! VolumeOsc CALCULATION
VolumeOsc is (expavg([Volume],FastLen7) / expavg([Volume],SlowLen7)-1)*100.

!BUY
SetUp7 if VolumeOsc > MFBUY7 and valrule(VolumeOsc <= MFBUY7,1) and [Close] > simpleavg([Close],MAPRICE7).
BUY_VolOsc if valrule(SetUp7,1) and [high] > EntryPr.
!SELL
SELL_VolOsc if [Close] < simpleavg([Close],MACSELL7) and VolumeOsc > MFSELL7
	or {position days} >= XTIME.

!FVE divergence test
!INPUTS:
!MFPERIOD is 21.
LRSBARS is 40.
STOCHBARS is 10.
STAVGBARS is 6.
!XTIME is 42.
FVEBUY8 is 0.
MASELL is 50.

!STOCHASTIC
STOCH is (simpleavg([Close]-loval([Low],STOCHBARS),3)*100)/(simpleavg(hival([High],STOCHBARS)-loval([Low],STOCHBARS),3)).
STOCHAVG is simpleavg(STOCH,STAVGBARS).

!BUY
DV_BUY_FVE if Slope([Close],LRSBARS)<0 and Slope2(FVE,LRSBARS)>0
	and STOCH > STOCHAVG and valrule(STOCH <= STOCHAVG,1) and FVE > FVEBUY8.
!SELL
DV_SELL_FVE if (Slope([Close],LRSBARS)>0 and Slope2(FVE,LRSBARS)<0
	and FVE > simpleavg(FVE,MASELL) and valrule(FVE <= simpleavg(FVE,MASELL),1))
	or {position days} >= XTIME.

!VFI divergence test
!INPUTs:
!MFPERIOD is 130.
!LRSBARS is 40.
!STOCHBARS is 10.
!STAVGBARS is 6.
!XTIME is 42.
MFBUY9 is 0.
!MASELL is 50.

!BUY
DV_BUY_VFI if Slope([Close],LRSBARS)<0 AND Slope2(VFI,LRSBARS)>0
	and STOCH > STOCHAVG and valrule(STOCH <= STOCHAVG,1)
	and VFI > MFBUY9.

!SELL
DV_SELL_VFI if (Slope([Close],LRSBARS)>0 and Slope2(VFI,LRSBARS)<0
	and VFI < simpleavg(VFI,MASELL) and valrule(VFI >= simpleavg(VFI,MASELL),1))
	or {position days} >= XTIME.

!VPT divergence test
!INPUTS:
!LRSBARS is 40.
!STOCHBARS is 10.
!STAVGBARS is 6.
!XTIME is 42.
!MASELL is 50.

!BUY
DV_BUY_VPT IF Slope([Close],LRSBARS)<0 AND Slope2(VPT,LRSBARS)>0
	and STOCH > STOCHAVG and valrule(STOCH <= STOCHAVG,1).

!SELL
DV_SELL_VPT if (Slope([Close],LRSBARS)>0 and Slope2(VPT,LRSBARS)<0
	and VPT < simpleavg(VPT,MASELL) and valrule(VPT >= simpleavg(VPT,MASELL),1))
	or {position days} >= XTIME.

!Volume oscillator divergence test
!INPUTS:
!LRSBARS is 40.
!STOCHBARS is 10.
!STAVGBARS is 6.
!XTIME is 42.
!MASELL is 50.
FastLen11 is 5.
SlowLen11 is 21.

!BUY
DIV_BUY_VolOsc if slope([Close],LRSBARS)<0 AND Slope2(VolumeOsc,LRSBARS)<0 AND STOCH > STOCHAVG.

!SELL
DIV_SELL_VolOsc if (Slope([Close],LRSBARS)>0 AND Slope2(VolumeOsc,LRSBARS)<0
	and [Close] < simpleavg([Close],MASELL) and valrule([Close] >= simpleavg([Close],MASELL),1))
	or {position days} >= XTIME.

!CMF divergence test
!INPUTS:
!MFPERIOD is 21.
!LRSBARS is 40.
!STOCHBARS is 10.
!STAVGBARS is 6.
!XTIME is 42.
MFBUY12 is 0.
!MASELL is 50.

!BUY
DIV_BUY_CMF if Slope([Close],LRSBARS)<0 AND Slope2(CMF,LRSBARS)>0
	and STOCH > STOCHAVG and valrule(STOCH <= STOCHAVG,1)
	and CMF > MFBUY12.
!SELL
DIV_SELL_CMF if (Slope([Close],LRSBARS)>0 AND Slope2(CMF,LRSBARS)<0
	and CMF > simpleavg(CMF,MASELL) and valrule(CMF <= simpleavg(CMF,MASELL),1))
	or {position days} >= XTIME.

!MFI divergence test
!INPUTs:
!MFPERIOD is 21.
!LRSBARS is 40.
!STOCHBARS is 10.
!STAVGBARS is 6.
!MASELL is 50.
!XTIME is 42.

!BUY
DIV_BUY_MFI if Slope([Close],LRSBARS)<0 and Slope2(MFI,LRSBARS)>0
	and STOCH > STOCHAVG and valrule(STOCH <= STOCHAVG,1).
!SELL
DIV_SELL_MFI if (Slope([Close],LRSBARS)>0 and Slope2(MFI,LRSBARS)<0
	and MFI < simpleavg(MFI,MASELL) and valrule(MFI < simpleavg(MFI,MASELL),1))
	or {position days} >= XTIME.

!OBV divergence test
!INPUTS:
!LRSBARS is 40.
!STOCHBARS is 10.
!STAVGBARS is 6.
!XTIME is 42.
MASELL14 is 30.

!BUY
DIV_BUY_OBV if Slope([Close],LRSBARS)<0 and Slope2(OBV,LRSBARS)>0
	and STOCH > STOCHAVG and valrule(STOCH <= STOCHAVG,1).

!SELL
DIV_SELL_OBV if (Slope([Close],LRSBARS)>0 and Slope2(OBV,LRSBARS)<0
	and OBV < simpleavg(OBV,MASELL14) and valrule(OBV >= simpleavg(OBV,MASELL14),1))
	or {position days} >= XTIME.

ShowValues if 1.

TRADERSSTUDIO: MONEY FLOW INDICATORS
For this month’s Traders’ Tip, I will provide TradersStudio code for the July 2011 article by Markos Katsanos, “Comparing Seven Money Flow Indicators.” The amount of code that was converted is quite extensive and includes seven functions that compute the seven money flow indicators as well as the code for the 14 systems that were used to make comparative tests of the seven indicators. Time did not permit me to run the comparative tests that were shown in the article.
The code can be downloaded from the TradersStudio website at www.TradersStudio.com → Traders Resources → FreeCode or www.TradersEdgeSystems.com/traderstips.htm. The code is also shown below.
'COMPARING SEVEN MONEY FLOW INDICATORS
'Author: Markos Katsanos, TASC July 2011
'Coded by: Richard Denning 7/17/2011
'www.TradersEdgeSystems.com

' LINEAR REGRESSION FUNCTION
'Parameters
' Y  specifies which Price Of the asset Of interest is To be used
' SLen the number Of trailing bars To consider
' TargetB represents the number Of bars into the future Or back into the past
' Returns a numeric value containing the current value Of the specified regression line at TargetB.
' Changes values of variables rSqrd, slopeR, endVal to those the least squares line computed by the function
' R squared (rSqrd) is the measure of how well the line fits the data (will vary from 0 (no fit) to 1.00 (perfect fit)
' slope (slopeR) is the rise over run of the line
' endVal is the value of the line at the current bar

'the regression formulas can be checked using the Excel tutorial on linear regression found at:
'https://phoenix.phys.clemson.edu/tutorials/excel/regression.html

Function LinearRegSRV(Y As BarArray, SLen, TargetB, ByRef rSqrd, ByRef slopeR, ByRef endVal) As BarArray
    Dim X As BarArray
    Dim Num1 As BarArray
    Dim Num2 As BarArray
    Dim SumX As BarArray
    Dim SumSqrX As BarArray
    Dim SumY As BarArray
    Dim SumSqrY As BarArray
    Dim SumXY As BarArray
    Dim Slope As BarArray
    Dim Intercept As BarArray

 If SLen <= 0 Then
    LinearRegSRV = 0
 Else

    SumX = 0
    SumSqrX = 0
    SumY = 0
    SumSqrY = 0
    SumXY = 0
    'Sum2 = 0

    For X = 0 To SLen - 1
        SumX = SumX + X
        SumSqrX = SumSqrX + X * X
        SumY = SumY + Y[X]
        SumSqrY = SumSqrY + Y[X] * Y[X]
        SumXY = SumXY + X * Y[X]
    Next

    'SumY = Summation(Price, SLen)
    'SumBars = SLen * (SLen - 1) * .5
    'SumSqrBars = (SLen - 1) * SLen * (2 * SLen - 1) / 6
    'Sum2 = SumBars * SumY
    'Num1 = SLen * Sum1 - Sum2
    'Num2 = SumBars * SumBars -SLen * SumSqrBars

  'slope
    If (SumSqrX - SumSqrY) <> 0 Then
        'Slope = Num1 / Num2
        Slope = (SumXY - SumX * SumY) / (SumSqrX - SumSqrY)
    Else
        Slope = 0
    End If

  'intercept
    Intercept = (SumY - Slope * SumX) / SLen
    slopeR = Slope

  'R squared
    If (Sqr((SumSqrX - SumX*SumX)*(SumSqrY - SumY * SumY))) <> 0 Then
        rSqrd = (SumXY - SumX * SumY) / (Sqr((SumSqrX - SumX*SumX)*(SumSqrY - SumY * SumY)))
    Else
        rSqrd = 0
    End If

  'end value of linear regression line
    endVal = Intercept + Slope * (SLen - 1)

  'projected value of linear regression line at target bar
    LinearRegSRV = Intercept + Slope * (SLen - 1 - TargetB)

 End If
End Function

Function STOCH_AVG(STOCHBARS,STAVGBARS,byref STOCH) As BarArray
    'Dim STOCH As BarArray
    If BarNumber>STOCHBARS Then
        If Average(Highest(H, STOCHBARS, 0)-Lowest(L, STOCHBARS, 0), 3, 0)>0 Then
            STOCH=(Average(C-Lowest(L, STOCHBARS, 0), 3, 0)*100)/(Average(Highest(H, STOCHBARS, 0)-Lowest(L, STOCHBARS, 0), 3, 0))
        Else
            STOCH=100
        End If
        STOCH_AVG=Average(STOCH, STAVGBARS, 0)
    End If
End Function

Function Summation(Price As BarArray, Length) as bararray
    Dim Counter
    Dim CSum As BarArray

    Counter = 0
    CSum = 0

    CSum = 0
    For Counter = 0 To Length - 1
        CSum = CSum + Price[Counter]
    Next
    Summation = CSum
End Function

Function FVE(MFPERIOD)
    Dim tp As BarArray
    Dim tp1 As BarArray
    Dim mf As BarArray
    Dim VolumePlusMinus As BarArray
    Dim FveSum As BarArray
    Dim ATRindi As BarArray
    Dim FveFactor As BarArray
    Dim intra As BarArray
    Dim inter As BarArray
    Dim vintra As BarArray
    Dim vinter As BarArray
    Dim cutoff As BarArray
    Dim va As BarArray

    tp=(H + L + C)/3
    tp1=(H[1]+L[1]+C[1])/3
    intra=Log(High)-Log(Low)
    vintra=StdDev(intra,MFPERIOD)
    inter=Log(tp)-Log(tp1)
    vinter=StdDev(inter,MFPERIOD)
    cutoff=0.1*vintra+0.1*vinter
    mf=(C - (H + L)/2)+ tp - tp1
    If mf>cutoff*C Then
        FveFactor=1
    Else
        If mf<-1*cutoff*C Then
            FveFactor=-1
        Else
            FveFactor=0
        End If
    End If
    'If BarNumber> MFPERIOD Then
        VolumePlusMinus = Vol * FveFactor
        va=Average(Vol, MFPERIOD, 0)
        FveSum = Average(VolumePlusMinus,MFPERIOD,0)*MFPERIOD
        If va<>0 Then
            FVE=(FveSum /(va*MFPERIOD))*100
        Else
            FVE=0
        End If
    'End If
End Function

Sub DIR_FVE_SYS(MFPERIOD, MABUY, MASELL, FVEBUY, FVESELL, XTIME, SDBARS, PREV, SDCR)
        'MFPERIOD = 21
        'MABUY = 60
        'MASELL = 60
        'FVEBUY = 10
        'FVESELL = 0
        'XTIME = 42
        'SDBARS = 30
        'PREV = 7
        'SDCR = 0.5
    Dim myFVE As BarArray
    Dim avgFVE As BarArray
    myFVE = FVE(MFPERIOD)
    avgFVE = Average(myFVE, MABUY, 0)
    If CrossesOver(myFVE,avgFVE ) And myFVE>FVEBUY And myFVE-myFVE[PREV]> SDCR*StdDev(myFVE,SDBARS,1) Then
            Buy("BUY_FVE_MA", 1, C + 0.05*C/100, Stop, Day)
    End If
    If CrossesUnder(myFVE, avgFVE) And myFVE < FVESELL Then
        ExitLong("MACROSS", "", 1, 0, Market, Day)
    End If
    If BarsSinceEntry -1 > XTIME Then
        ExitLong("XTIME", "", 1, 0, Market, Day)
    End If
End Sub

Sub DIVERG_FVE_SYS(MFPERIOD, LRSBARS, STOCHBARS, STAVGBARS, XTIME, FVEBUY, MAsell)
    Dim myFVE As BarArray
    Dim stoch As BarArray
    Dim stochAvg As BarArray
    Dim rSqrd,slopeR,endVal,rSqrdFVE,slopeR_FVE,endValFVE,LRC,LR_FVE
        'MFPERIOD = 21
        'LRSBARS = 40
        'STOCHBARS = 10
        'STAVGBARS = 6
        'XTIME = 42
        'FVEBUY = 0
        'MAsell = 50
    myFVE = FVE(MFPERIOD)
    stochAvg=STOCH_AVG(STOCHBARS,STAVGBARS,stoch)
    LRC=LinearRegSRV(C, LRSBARS, 0, rSqrd, slopeR, endVal)
    LR_FVE=LinearRegSRV(myFVE,LRSBARS,0,rSqrdFVE,slopeR_FVE,endValFVE)
    If slopeR<0 And slopeR_FVE>0 And CrossesOver(stoch, stochAvg) And myFVE>FVEBUY Then
        Buy("BUY_FVE_DIV", 1, 0, Market, Day)
    End If
    If slopeR>0 And slopeR_FVE<0 And CrossesUnder(myFVE, Average(myFVE, MAsell, 0)) Then
        ExitLong("NEG_FVE_DIV", "", 1, 0, Market, Day)
    End If
    If BarsSinceEntry - 1 > XTIME Then
        ExitLong("XTIME", "", 1, 0, Market, Day)
    End If
End Sub

Function VFI(PERIOD)
    Dim TP As BarArray
    Dim TP1 As BarArray
    Dim Inter As BarArray
    Dim VInter As BarArray
    Dim CutOff As BarArray
    Dim VAve As BarArray
    Dim VMax As BarArray
    Dim VC As BarArray
    Dim MF As BarArray
    Dim DirectionalVolume As BarArray
    Dim myVFI As BarArray

    TP=(High + Low + Close)/3
    If TP > 0 And TP[1] > 0 Then
        Inter = Log(TP) - Log(TP[1])
    Else
        Inter = 0
    End If
    VInter = StdDev(Inter, 30)
    CutOff = .2 * VInter * Close
    VAve = Average(V, PERIOD,  1 )
    VMax = VAve * 2.5
    VC = IFF(V < VMax , V, VMax)
    MF = TP - TP[1]
    DirectionalVolume = IFF(MF > CutOff, +VC, IFF(MF < -CutOff, -VC, 0))
    If VAve <> 0 Then
        myVFI = Summation(DirectionalVolume, PERIOD) / VAve
    Else
        myVFI = 0
    End If
    myVFI = XAverage(myVFI, 3, 0)
    VFI = myVFI
End Function

Sub DIR_VFI_SYS(PERIOD, MABUY, MASELL, MFBUY, MFSELL, XTIME, SDBARS, PREV, SDCR)
    Dim TP As BarArray
    Dim TP1 As BarArray
    Dim Inter As BarArray
    Dim VInter As BarArray
    Dim CutOff As BarArray
    Dim VAve As BarArray
    Dim VMax As BarArray
    Dim VC As BarArray
    Dim MF As BarArray
    Dim DirectionalVolume As BarArray
    Dim myVFI As BarArray
        'PERIOD = 130
        'MABUY = 40
        'MASELL = 30
        'MFBUY = 0
        'MFSELL = 0
        'XTIME = 42
        'SDBARS = 30
        'PREV = 7
        'SDCR = 0
    myVFI=VFI(PERIOD)
    'If BarNumber>PERIOD+MABUY Then
        If CrossesOver(myVFI, Average(myVFI, MABUY, 0)) And myVFI>MFBUY And myVFI-myVFI[PREV]> SDCR*StdDev(myVFI,SDBARS,1) Then
            Buy("MA", 1, Close+.05*C/100, Stop, Day)
        End If
    'End If
    If CrossesUnder(myVFI, Average(myVFI, MASELL, 0)) And myVFI < MFSELL Then
        ExitLong("", "", 1, 0, Market, Day)
    End If
    If BarsSinceEntry - 1 > XTIME Then
        ExitLong("XTIME", "", 1, 0, Market, Day)
    End If
End Sub

Sub DIVERG_VFI_SYS(MFPERIOD, LRSBARS, STOCHBARS, STAVGBARS, XTIME, MFBUY, MASELL)
    Dim myVFI As BarArray
    Dim STOCH As BarArray
    Dim STOCHAVG As BarArray
    Dim rSqrd,slopeR,endVal,rSqrdVFI,slopeR_VFI,endValVFI,LRC,LR_VFI
        'MFPERIOD = 130
        'LRSBARS = 40
        'STOCHBARS = 10
        'STAVGBARS = 6
        'XTIME = 42
        'MFBUY = 0
        'MASELL = 50
    myVFI = FVE(MFPERIOD)
    STOCHAVG=STOCH_AVG(STOCHBARS,STAVGBARS,STOCH)
    LRC=LinearRegSRV(C, LRSBARS, 0, rSqrd, slopeR, endVal)
    LR_VFI=LinearRegSRV(myVFI,LRSBARS,0,rSqrdVFI,slopeR_VFI,endValVFI)
    'If BarNumber>LRSBARS+MFPERIOD+30 Then
        If slopeR<0 And slopeR_VFI>0 And CrossesOver(STOCH, STOCHAVG) And  myVFI>MFBUY Then
            Buy("BUY_VFI_DIV", 1, 0, Market, Day)
        End If
        If slopeR>0 And slopeR_VFI<0 And CrossesUnder(myVFI, Average(myVFI, MASELL, 0)) Then
            ExitLong("NEG_VFI_DIV", "", 1, 0, Market, Day)
        End If
    'End If
    If BarsSinceEntry - 1 > XTIME Then
        ExitLong("XTIME", "", 1, 0, Market, Day)
    End If
End Sub

Function CMF(MFPERIOD)
    Dim AccDist As BarArray
    If High - Low <> 0 And Vol <> 0 Then
        AccDist = ((C - L) - (H - C)) / (H - L) * Vol
    End If
    CMF = summation(AccDist, MFPERIOD) / summation(Vol, MFPERIOD) * 100
End Function

Sub DIR_CMF_SYS(MFPERIOD, MABUY, MASELL, MFBUY, MFSELL, XTIME, SDBARS, PREV, SDCR)
    Dim AccDist As BarArray
    Dim myCMF As BarArray
        'MFPERIOD = 21
        'MABUY = 50
        'MASELL = 40
        'MFBUY = 5
        'MFSELL = -5
        'XTIME = 42
        'SDBARS = 30
        'PREV = 7
        'SDCR = 1
    myCMF = CMF(MFPERIOD)
    If CrossesOver(myCMF, Average(myCMF, MABUY, 0)) And myCMF>MFBUY And myCMF-myCMF[PREV]> SDCR*StdDev(myCMF,SDBARS,1) Then
        Buy("MA", 1, Close + 0.05*C/100, Stop, Day)
    End If
    If CrossesUnder(myCMF, Average(myCMF, MASELL, 0)) And myCMF < MFSELL Then
        ExitLong("SELLMACROSS", "", 1, 0, Market, Day)
    End If
    If BarsSinceEntry - 1 > XTIME Then
        ExitLong("XTIME", "", 1, 0, Market, Day)
    End If
End Sub

Sub DIVERG_CMF_SYS(MFPERIOD, LRSBARS, STOCHBARS, STAVGBARS, XTIME, MFBUY, MASELL)
    Dim myCMF As BarArray
    Dim STOCH As BarArray
    Dim STOCHAVG As BarArray
    Dim rSqrd,slopeR,endVal,rSqrdCMF,slopeR_CMF,endValCMF,LRC,LR_CMF
        'MFPERIOD = 21
        'LRSBARS = 40
        'STOCHBARS = 10
        'STAVGBARS = 6
        'XTIME = 42
        'MFBUY = 0
        'MASELL = 50
    myCMF=CMF(MFPERIOD)
    STOCHAVG=STOCH_AVG(STOCHBARS,STAVGBARS,STOCH)
    LRC=LinearRegSRV(C, LRSBARS, 0, rSqrd, slopeR, endVal)
    LR_CMF=LinearRegSRV(myCMF,LRSBARS,0,rSqrdCMF,slopeR_CMF,endValCMF)

    If slopeR<0 And slopeR_CMF>0 And CrossesOver(STOCH, STOCHAVG) And myCMF>MFBUY Then
        Buy("BUY_CMF_DIV", 1, 0, Market, Day)
    End If
    If slopeR>0 And slopeR_CMF<0 And CrossesUnder(myCMF, Average(myCMF, MASELL, 0)) Then
        ExitLong("NEG_CMF_DIV", "", 1, 0, Market, Day)
    End If
    If MarketPos(0)=1 And BarsSinceEntry-1>XTIME Then
        ExitLong("XTIME", "", 1, 0, Market, Day)
    End If
End Sub

Function MFI(MFPERIOD) As BarArray
    Dim TP As BarArray
    Dim POSMF As BarArray
    'Dim NEGMF As BarArray
    Dim UpSum As BarArray
    'Dim DnSum As BarArray

    If BarNumber>MFPERIOD Then
        TP = (H+L+C)/3
        POSMF=IFF(TP > TP[1],TP * V,0)
        UpSum=Summation(POSMF,MFPERIOD)
        'DnSum=Summation(NEGMF,MFPERIOD)
        MFI=UpSum*100/SUMMATION(TP*V,MFPERIOD)
    End If
End Function

Sub DIR_MFI_SYS(MFPERIOD, MABUY, MASELL, MFBUY, MFSELL, XTIME, PREV, SDCR)
    Dim TP As BarArray
    Dim POSMF As BarArray
    Dim NEGMF As BarArray
    Dim UpSum As BarArray
    Dim DnSum As BarArray
    Dim myMFI As BarArray
        'MFPERIOD = 21
        'MABUY = 50
        'MASELL = 30
        'MFBUY = 50
        'MFSELL = 60
        'XTIME = 42
        'PREV = 7
        'SDCR = 1
    'If BarNumber>MFPERIOD Then
        myMFI = MFI(MFPERIOD)
    'End If
    If CrossesOver(myMFI, Average(myMFI, MABUY, 0)) And myMFI > MFBUY And myMFI-myMFI[PREV] > SDCR*StdDev(myMFI,30,1) Then
        Buy("MFI", 1, Close+.05*C/100, Stop, Day)
    End If
    If CrossesUnder(myMFI, Average(myMFI, MASELL, 0)) And myMFI < MFSELL Then
        ExitLong("SELLMACROSS", "", 1, 0, Market, Day)
    End If
    If BarsSinceEntry - 1 > XTIME Then
        ExitLong("XTIME", "", 1, 0, Market, Day)
    End If
End Sub

Sub DIVERG_MFI_SYS(MFPERIOD, LRSBARS, STOCHBARS, STAVGBARS, MASELL, XTIME)
    Dim myMFI As BarArray
    Dim STOCH As BarArray
    Dim STOCHAVG As BarArray
    Dim rSqrd,slopeR,endVal,rSqrdMFI,slopeR_MFI,endValMFI,LRC,LR_MFI
        'MFPERIOD = 21
        'LRSBARS = 40
        'STOCHBARS = 10
        'STAVGBARS = 6
        'MASELL = 50
        'XTIME = 42
    myMFI=MFI(MFPERIOD)
    STOCHAVG=STOCH_AVG(STOCHBARS,STAVGBARS,STOCH)
    LRC=LinearRegSRV(C, LRSBARS, 0, rSqrd, slopeR, endVal)
    LR_MFI=LinearRegSRV(myMFI,LRSBARS,0,rSqrdMFI,slopeR_MFI,endValMFI)
    'If BarNumber>MFPERIOD+LRSBARS Then
        If slopeR<0 And slopeR_MFI>0 And CrossesOver(STOCH, STOCHAVG) Then
            Buy("BUY_MFI_DIV", 1, 0, Market, Day)
        End If
        If slopeR>0 And slopeR_MFI<0 And CrossesUnder(myMFI, Average(myMFI, MASELL, 0)) Then
            ExitLong("NEG_MFI_DIV", "", 1, 0, Market, Day)
        End If
    'End If
    If BarsSinceEntry-1>XTIME Then
        ExitLong("XTIME", "", 1, 0, Market, Day)
    End If
End Sub

Function OBV() As BarArray
    If Close > Close[1] Then
        OBV = OBV[1] + Vol
    Else
        If Close < Close[1] Then
            OBV = OBV[1] - Vol
        Else
            OBV = OBV[1]
        End If
    End If
End Function

Sub DIR_OBV_SYS(MABUY, MAFAST, MASELL, XTIME, PREV, SDCR)
    Dim myOBV As BarArray
        'MABUY = 70
        'MAFAST = 5
        'MASELL = 30
        'XTIME = 42
        'PREV = 7
        'SDCR = 0.5
    myOBV = OBV()
    'If BARNUMBER>=21+MABUY Then
        If CrossesOver(myOBV, Average(myOBV, MAFAST, 0)) AND myOBV-myOBV[PREV]> SDCR*StdDev(myOBV,30,1) AND myOBV>Average(myOBV, MABUY, 0) Then
            Buy("BUY_OBV_DIR", 1, CLOSE+.05*C/100, Stop, Day)
        End If
    'End If
    If CrossesUnder(myOBV, Average(myOBV, MASELL, 0)) Then
        ExitLong("MACROSS", "", 1, 0, Market, Day)
    End If
    If MarketPos(0)=1 and barssinceentry-1>Xtime Then
        ExitLong("XTIME", "", 1, 0, Market, Day)
    End If
End Sub

Sub DIVERG_OBV_SYS(LRSBARS, STOCHBARS, STAVGBARS, XTIME, MASELL)
    Dim myOBV As BarArray
    Dim STOCH As BarArray
    Dim STOCHAVG As BarArray
    Dim rSqrd,slopeR,endVal,rSqrdOBV,slopeR_OBV,endValOBV,LRC,LR_OBV
        'LRSBARS = 40
        'STOCHBARS = 10
        'STAVGBARS = 6
        'XTIME = 42
        'MASELL = 30
    myOBV=OBV()
    STOCHAVG=STOCH_AVG(STOCHBARS,STAVGBARS,STOCH)
    LRC=LinearRegSRV(C, LRSBARS, 0, rSqrd, slopeR, endVal)
    LR_OBV=LinearRegSRV(myOBV,LRSBARS,0,rSqrdOBV,slopeR_OBV,endValOBV)
    'If BarNumber>=LRSBARS Then
        If slopeR<0 And slopeR_OBV>0 And CrossesOver(STOCH, STOCHAVG) Then
            Buy("BUY_OBV_DIV", 1, 0, Market, Day)
        End If
        If slopeR>0 And slopeR_OBV<0 And CrossesUnder(myOBV, Average(myOBV, MASELL, 0)) Then
            ExitLong("NEG_OBV_DIV", "", 1, 0, Market, Day)
        End If
    'End If
    If BarsSinceEntry-1>XTIME Then
        ExitLong("XTIME", "", 1, 0, Market, Day)
    End If
End Sub


Function VPT() As BarArray
    VPT = VPT[1] + V*(C-C[1])/C[1]
End Function

Sub DIR_VPT_SYS(MABUY, MAFAST, MASELL, XTIME, SDBARS, PREV, SDCR)
    Dim myVPT As BarArray
        'MABUY = 60
        'MAFAST = 5
        'MASELL = 40
        'XTIME = 42
        'SDBARS = 30
        'PREV = 7
        'SDCR = 1.5
    myVPT = VPT()
    'If BarNumber>=21+MABUY Then
        If CrossesOver(myVPT, Average(myVPT, MAFAST, 0)) And myVPT-myVPT[PREV]> SDCR*StdDev(myVPT,SDBARS,1) And myVPT>Average(myVPT, MABUY,0) Then
               Buy("BUY_VPT_DIR", 1, Close+.05*C/100, Stop, Day)
        End If
        If CrossesUnder(myVPT, Average(myVPT, MASELL, 0)) Then
            ExitLong("VPTX", "", 1, 0, Market, Day)
        End If
    'End If
    If BarsSinceEntry-1>XTIME Then
        ExitLong("XTIME", "", 1, 0, Market, Day)
    End If
End Sub

Sub DIVERG_VPT_SYS(LRSBARS, STOCHBARS, STAVGBARS, XTIME, MASELL)
    Dim myVPT As BarArray
    Dim STOCH As BarArray
    Dim STOCHAVG As BarArray
    Dim rSqrd,slopeR,endVal,rSqrdVPT,slopeR_VPT,endValVPT,LRC,LR_VPT
        'LRSBARS = 40
        'STOCHBARS = 10
        'STAVGBARS = 6
        'XTIME = 42
        'MASELL = 50
    myVPT= VPT()
    STOCHAVG=STOCH_AVG(STOCHBARS,STAVGBARS,STOCH)
    LRC=LinearRegSRV(C, LRSBARS, 0, rSqrd, slopeR, endVal)
    LR_VPT=LinearRegSRV(myVPT,LRSBARS,0,rSqrdVPT,slopeR_VPT,endValVPT)
    'If BarNumber>=LRSBARS Then
        If slopeR<0 And slopeR_VPT>0 And CrossesOver(STOCH, STOCHAVG) Then
            Buy("BUY_VPT_DIV", 1, 0, Market, Day)
        End If
        If slopeR>0 And slopeR_VPT<0 And CrossesUnder(myVPT, Average(myVPT, MASELL, 0)) Then
            ExitLong("NEG_VPT_DIV", "", 1, 0, Market, Day)
        End If
    'End If
    If BarsSinceEntry-1>XTIME Then
        ExitLong("XTIME", "", 1, 0, Market, Day)
    End If
End Sub

Function VolumeOsc(FASTLEN,SLOWLEN) As BarArray
    If BarNumber>=SLOWLEN Then
        VolumeOsc=(XAverage(V, FASTLEN, 0)/ XAverage(V, SLOWLEN, 0)-1)*100
    End If
End Function

Sub DIR_VolOsc_SYS(MFBUY, MFSELL, XTIME, FAST_LEN, SLOW_LEN, MAPRICE, MACSELL)
    Dim VolOsc As BarArray
        'MFBUY = 25
        'MFSELL = 25
        'XTIME = 42
        'Fast_Len = 5
        'Slow_Len = 21
        'MAPRICE = 50
        'MACSELL = 10
    VolOsc=VolumeOsc(FAST_LEN,SLOW_LEN)
    If CrossesOver(VolOsc, MFBUY) And C > Average(C, MAPRICE, 0) Then
        Buy("BUY_VOLOSC_DIR", 1, Close+.05*C/100, Stop, Day)
    End If
    If CrossesUnder(C, Average(C, MACSELL, 0)) And VolOsc > MFSELL Then
        ExitLong("VOLOSC_X", "", 1, 0, Market, Day)
    End If
    If BarsSinceEntry-1>XTIME Then
        ExitLong("XTIME", "", 1, 0, Market, Day)
    End If
End Sub

Sub DIVERG_VolOsc_SYS(LRSBARS, STOCHBARS, STAVGBARS, XTIME, MASELL, FastLen, SlowLen)
    Dim myVolOsc As BarArray
    Dim STOCH As BarArray
    Dim STOCHAVG As BarArray
    Dim rSqrd,slopeR,endVal,rSqrdVolOsc,slopeR_VolOsc,endValVolOsc,LRC,LR_VolOsc
        'LRSBARS = 40
        'STOCHBARS = 10
        'STAVGBARS = 6
        'XTIME = 42
        'MASELL = 50
        'FastLen = 5
        'SlowLen = 21
    myVolOsc=VolumeOsc(FastLen,SlowLen)
    STOCHAVG=STOCH_AVG(STOCHBARS,STAVGBARS,STOCH)
    LRC=LinearRegSRV(C, LRSBARS, 0, rSqrd, slopeR, endVal)
    LR_VolOsc=LinearRegSRV(myVolOsc,LRSBARS,0,rSqrdVolOsc,slopeR_VolOsc,endValVolOsc)
    'If BarNumber>=LRSBARS Then
        If slopeR<0 And slopeR_VolOsc>0 And CrossesOver(STOCH, STOCHAVG) Then
            Buy("BUY_VolOsc_DIV", 1, 0, Market, Day)
        End If
        If slopeR>0 And slopeR_VolOsc<0 AND CrossesUnder(C, Average(C, MASELL, 0)) Then
            ExitLong("NEG_VolOsc_DIV", "", 1, 0, Market, Day)
        End If
    'End If
    If BarsSinceEntry-1>XTIME Then
        ExitLong("XTIME", "", 1, 0, Market, Day)
    End If
End Sub

STRATASEARCH: SEPTEMBER 2011
Although Andrew Coles’ article in this issue discusses two different formulas, we decided to focus exclusively on Tom DeMark’s TD Sequential indicator (or the “September 2011 Traders’ Tips Article Code” referred to above). In addition to being originally intended for use with daily price bars, TD Sequential can also be used for backtesting. Ermanometry, on the other hand, uses a number of parameters that must be revised manually for each time period, and therefore cannot be backtested easily.
The issue that immediately arises with TD Sequential is that signals don’t come up very frequently. Running against the S&P 500 stocks from 2000 to the present, TD Sequential produced only 369 trades in our tests. That’s less than one trade every 11 years, per stock. Furthermore, using the TD Sequential sell Setup as the exit, holding periods were nearly four years long. Such long holding periods helped create drawdowns exceeding 50%, which many traders would find unacceptable considering the system’s moderate gains.
As a test, we decided to see how effective TD Sequential would be using only the buy Setup, and relying on alternate indicators for the sell signal. Using the automated search in StrataSearch, we searched thousands of supporting trading rules and found some impressive results. Many indicator combinations had holding periods of one month or less, with percent profitability exceeding 70%. Annual returns were often over 40%, with drawdowns as low as 20%. In short, the TD Sequential indicator can produce some impressive results, but only when paired with the proper supporting indicators.
StrataSearch users can easily search for supporting indicators for the September 2011 Traders’ Tips Article Code by downloading the plugin from the Shared Area of the StrataSearch user forum. After importing the plugin, simply launch the automated search to explore TD Sequential alongside thousands of supporting trading rules.
A sample chart is shown in Figure 7.
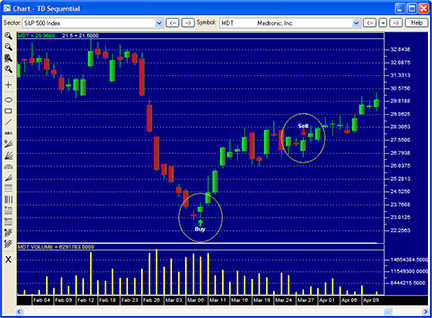
Figure 7: STRATASEARCH. In this system, the buy signal is triggered by the September 2011 Traders’ Tips Article Code, but the sell signal is triggered by a price oscillator divergence.
//*********************************************************
// TD Sequential - Buy Setup
//*********************************************************
value = parameter("Value");
TDSequentialBuy = if(
	HadAlert(value < ref(value, -1), 9) = 9 and
	ref(value, -9) > ref(value, -13), 1, 0);

//*********************************************************
// TD Sequential - Sell Setup
//*********************************************************
value = parameter("Value");
TDSequentialSell = if(
	HadAlert(value > ref(value, -1), 9) = 9 and
	ref(value, -9) < ref(value, -13), 1, 0);

TRADECISION: SEPTEMBER 2011
In this issue, author Andrew Coles describes how to automate the September 2011 Traders’ Tips Article Code and Ermanometry techniques to apply to intraday charts.
Below is the Tradecision code to recreate the Ermanometry indicator using Tradecision’s Indicator Builder. Following that is the code to recreate the September 2011 Traders’ Tips Article Code strategy using Tradecision’s Strategy Builder.
To import the strategy into Tradecision, visit the area “Traders’ Tips from Tasc Magazine” at www.tradecision.com/support/tasc_tips/tasc_traders_tips.htm or copy the code below.
ERMANOMETRY indicator:

input
StartingYear:"Starting Year", 2010, 1980, 2100;
StartingMonth:"starting month", 1, 1, 12;
StartingDay:"starting day of month", 1, 1, 31;
StartingHour:"hour", 1, 1, 24;
StartingMinute:"minute", 0, 0, 60;
EF:"seed segment EF (first wave)", 10, 1, 900;
DE:"seed segment DE (second wave)", 10, 1, 900;
end_input

var
Ratio:=0;
Inverseratio:=0;
StartBar:=0;
StartFound:=false;
x:=0;
CD:=0;
BC:=0;
AB:=0;
FG:=0;
GH:=0;
HI:=0;
IJ:=0;
FH:=0;
end_var

if HistorySize > 0 then  begin
   startFound:=startFound\1\;
   StartBar:=startBar\1\;
                         end;

if (not startFound and Year = StartingYear and Month = StartingMonth and DayOfMonth = StartingDay and Hour = StartingHour and Minute = StartingMinute) then
begin
   startBar:=BarNumber();
   startFound:=true;
end;

if (not startFound) then
   return 0;

Ratio:=EF / DE;
Inverseratio:=1 / (EF / DE);
CD:=DE * Inverseratio;
BC:=CD * Inverseratio;
AB:=BC * Inverseratio;
FG:=EF * Ratio;
GH:=FG * Ratio;
HI:=GH * Ratio;
IJ:=HI * Ratio;
FH:=SquareRoot(Power(FG, 2) + Power(GH, 2));
x:= barnumber - startbar;

{start of calculations}
if x = Int(FH) then return 1; {Erman}
if x = Int(GH) then return 1; {Erman}
if x = Int(HI) then return 1; {Erman}
if x = Int(IJ) then return 1; {Erman}
if x = Int(DE + EF + CD) then return 1; {Erman}
if x = Int(GH + HI + IJ) then return 1; {Erman}
if x = Int(CD + DE + EF + FG + GH + HI) then return 1; {Erman}
if x = Int(EF + FG + GH) then return 1; {Erman}
if x = Int(CD + DE + EF + FG + GH) then return 1; {Erman}
if x = Int(CD + DE + EF + FG + GH + HI) then return 1; {Erman}
if x = Int(GH + IJ + CD + AB + EF) then return 1; {Erman}

if x = Int(FH + FG + GH) then return 1; {Coles}
if x = Int(AB + BC + CD + DE) then return 1; {Coles}
if x = Int(AB + BC + CD + DE + GH) then return 1; {Coles}
if x = Int(FG + GH) then return 1; {Coles}
if x = Int(GH + HI) then return 1; {Coles}
if x = Int(FG + BC + CD) then return 1; {Coles}
if x = Int(FG + BC + CD + DE) then return 1; {Coles}
if x = Int(CD + BC) then return 1; {Coles}
if x = Int(DE + BC) then return 1; {Coles}
if x = Int(SquareRoot(Power(CD, 2) + Power(DE, 2)) + CD + DE) then return 1; {Coles}
if x = Int(SquareRoot(Power(EF, 2) + Power(FG, 2)) + EF + FG) then return 1; {Coles}

return 0;
Using Tradecision’s Strategy Builder, one needs to create the September 2011 Traders’ Tips Article Code strategy:
September 2011 Traders' Tips Article Code strategy:

Entry Long:

var
x:= Close;
y:=0;
count:=0;
i:=0;
end_var
y:=iff(x = O, O, iff(x = H, H, iff(x = L, L, iff(x = C, L, iff(x = V, V, 0)))));

if HISTORYSIZE > 14 then begin

for i := 0 to 9 do
begin
     if y\i\ < y\4 +i\ then
        count := count + 1;
end;

return count = 9 and y\9\ > y\13\;
end;
return false;


Entry Short:

var
x:= Close;
y:=0;
count:=0;
i:=0;
end_var
y:=iff(x = O, O, iff(x = H, H, iff(x = L, L, iff(x = C, L, iff(x = V, V, 0)))));

if HISTORYSIZE > 14 then begin

for i := 0 to 9 do
begin
     if y\i\ > y\4 +i\ then
        count := count + 1;
end;

return count = 9 and y\9\ < y\13\;
end;
return false;


TD SEQUENTIAL strategy:

Entry Long:

var
x:= Close;
y:=0;
count:=0;
i:=0;
end_var
y:=iff(x = O, O, iff(x = H, H, iff(x = L, L, iff(x = C, L, iff(x = V, V, 0)))));

if HISTORYSIZE > 14 then begin

for i := 0 to 9 do
begin
     if y\i\ < y\4 +i\ then
        count := count + 1;
end;

return count = 9 and y\9\ > y\13\;
end;
return false;


Entry Short:

var
x:= Close;
y:=0;
count:=0;
i:=0;
end_var
y:=iff(x = O, O, iff(x = H, H, iff(x = L, L, iff(x = C, L, iff(x = V, V, 0)))));

if HISTORYSIZE > 14 then begin

for i := 0 to 9 do
begin
     if y\i\ > y\4 +i\ then
        count := count + 1;
end;

return count = 9 and y\9\ < y\13\;
end;
return false;

NINJATRADER: SEPTEMBER 2011
The Ermanometry indicator and September 2011 Traders’ Tips Article Code strategy, as presented by Andrew Coles in his article in this issue, have now been implemented in NinjaTrader as an automated strategy and indicator available for download at www.ninjatrader.com/SC/September2011SC.zip.
Once it has been downloaded, select the menu File → Utilities → Import NinjaScript from within the NinjaTrader Control Center window and select the downloaded file. This file is for NinjaTrader version 7 or greater.
You can review the strategy source code by selecting the menu Tools → Edit NinjaScript → Strategy from within the NinjaTrader Control Center window and selecting “TdSequential.”
You can review the indicator source code by selecting the menu Tools → Edit NinjaScript → Indicator from within the NinjaTrader Control Center window and selecting “Ermanometry.”
NinjaScript uses compiled Dlls that run native, not interpreted, which provides you with the highest performance possible.
A sample chart implementing the strategy is shown in Figure 8.
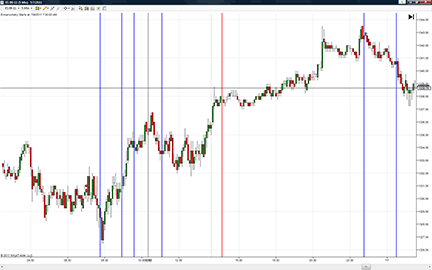
Figure 8: NINJATRADER, Ermanometry indicator. This screenshot shows the Ermanometry indicator applied to a five-minute chart of the emini S&P (ES 09-11).

UPDATA: SEPTEMBER 2011
This tip is based on the article by Andrew Coles in the September 2011 issue of Technical Analysis of Stocks & Commodities. In the article, Coles describes uses of the September 2011 Traders’ Tips Article Code and William Erman’s study of growth patterns (Ermanometry) in timing long and short entries for intraday strategies.
The Updata code for both indicators has now been added to the Updata Library and may be downloaded by clicking the Custom menu and then either “Indicator” or “System Library.” Those who cannot access the library due to a firewall may paste the code below into the Updata custom editor and save it.
A sample chart is shown in Figure 9.
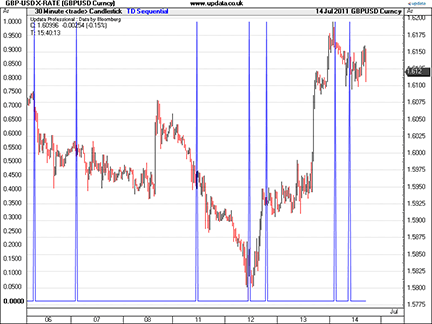
FIGURE 9: UPDATA, September 2011 Traders’ Tips Article Code. This chart shows the September 2011 Traders’ Tips Article Code applied to spot rate GBP/USD, with notable reversals successfully picked out.
PARAMETER "O[1],H[2],L[3],C[4],V[5]" #OHLC=4
DISPLAYSTYLE LINE
PLOTSTYLE LINE RGB(0,0,255)
INDICATORTYPE CHART SUPERIMPOSELEFT
@LongCount=0
@SellCount=0
#BuySetUp=0
#SellSetUp=0
@Price=0

FOR #CURDATE=9 TO #LASTDATE

      If #OHLC=1
         @Price=OPEN
      ElseIf #OHLC=2
          @Price=HIGH
      ElseIf #OHLC=3
          @Price=LOW
      ElseIf #OHLC=4
          @Price=CLOSE
      ElseIf #OHLC=5
          @Price=VOL
      EndIf

      'Buy Setup Initial
      If @Price<Hist(@Price,4)
         @LongCount=@LongCount+1
      Else
        @LongCount=0
      EndIf

      'Sell Setup Initial
      If @Price>Hist(@Price,4)
         @SellCount=@SellCount+1
      Else
        @SellCount=0
      EndIf

      'Buy Confirmation
      If Hist(@LongCount,1)>=9 AND @Price>Hist(@Price,4)
         #BuySetUp=1
      Else
         #BuySetUp=0
      EndIf
      'Sell Confirmation
      If Hist(@SellCount,1)>=9 AND @Price<Hist(@Price,4)
         #SellSetUp=1
      Else
         #SellSetUp=0
      EndIf

      @Plot=#BuySetUp+#SellSetUp

NEXT

TRADESIGNAL: SEPTEMBER 2011
The September 2011 Traders’ Tips Article Code and Ermanometry indicators can easily be used with our online charting tool at www.tradesignalonline.com. At our website, check the Infopedia section for our Lexicon. There, you will see the indicator and functions, which you can make available for your personal account. Simply click on it and select “Open script.” The indicator and functions will immediately be available for you to apply to any chart you wish.
The source code is also shown below, or can be downloaded here:
****** Source Code for the Ermanometry Indicator*******
Meta:
       Weblink("https://www.tradesignalonline.com/lexicon/view.aspx?id=17169"),
       Synopsis("Based on the article 'TD Sequential And Ermanometry For Intraday Traders' by Andrew Coles from the 09/2011 issue of Stocks and Commodities."),
       ShortCode("ERM");

Inputs:
       Start_Cond( Bars_Back, Date_Time ),
       Bars( 500 ),
       Start_Date( "02.01.2011" ),
       Start_Time( 1000 ),
       EF( 100, 1 , 900 ),
       DE( 50, 1, 900 );

Vars:
       startCond, ratio, inverseratio, x, ab, cd, gh, fg, ij, hi, fh, bc;

If Start_Cond = 0 Then
       startCond = CurrentBar = LastBar - Bars
Else startCond = Date = ResolveDate( Start_Date ) And Time = Start_Time ;

If startCond Then
       DrawSymbol( Close, "Start", SymbolVerticalLine, 1, Black, Black );

ratio = EF/DE;
Inverseratio = 1/(EF/DE);
x = BarsSince( startCond );

CD = DE * Inverseratio;
BC = CD * Inverseratio;
AB = BC * Inverseratio;
FG = EF * Ratio;
GH = FG * Ratio;
HI = GH * Ratio;
IJ = HI * Ratio;

FH = Sqrt(Power(FG,2)+Power(GH,2));

If ( x=Int(FH+FG+GH) Or x=Int(FH) Or x=Int(GH) Or x=Int(HI) or x=Int(IJ) Or x=Int(DE+EF+CD) Or x=Int(GH+HI+IJ) or x=Int(CD+DE+EF+FG+GH+HI) or x=Int(EF+FG+GH) Or x=Int(CD+DE+EF+FG+GH) Or x=Int(CD+DE+EF+FG+GH+HI) Or x=Int(GH+IJ+CD+AB+EF )
Or x=Int(FH+FG+GH) Or x=Int(AB+BC+CD+DE) Or x=Int(AB+BC+CD+DE+GH) Or x=Int(FG+GH) Or x=Int(GH+HI) or x=Int(FG+BC+CD) Or x=Int(FG+BC+CD+DE) or x=Int(CD+BC) Or x=Int(DE+BC) or x=Int(Sqrt(Power(CD,2)+Power(DE,2))+CD+DE) Or x=Int(Sqrt(Power(EF,2)+Power(FG,2))+EF+FG) ) Then
       DrawSymbol( Close, "Spiral", SymbolVerticalLine, 1, Black, Black );


// *** Copyright tradesignal GmbH ***
// *** www.tradesignal.com ***


****** Source Code for the Count Down Indicator*******
Meta:
       Weblink("https://www.tradesignalonline.com/lexicon/view.aspx?id=17169"),
       Synopsis("Based on the article 'TD Sequential And Ermanometry For Intraday Traders' by Andrew Coles from the 09/2011 issue of Stocks and Commodities."),
       ShortCode("CD"),
       Subchart( False );

Inputs:
       Price( Close );

Vars:
       bullSetup, bearSetup, bullCount, bearCount, initBuy, initSell,
       bearishFlip, bullishFlip;

If CurrentBar = 1 Then
       Begin
             bullCOunt = 0;
             bearCount = 0;
       End;

bearishFlip = Close[1] > Close[5] And Close < Close[4];
bullishFlip = Close[1] < Close[5] And Close > Close[4];

If Price < Price[4] Then
       Begin
             If ( bullCount = 0 And bearishFlip ) Or bullCount > 0 Then
                    bullCount = bullCount + 1;
       End
Else bullCount = 0;

If bullCount = 9 Then
       Begin
             DrawSymbol( Close, "Buy Setup", SymbolVerticalLine, 1, DarkGreen, DarkGreen );
             bullCount = 0;
       End;

If Price > Price[4] Then
       Begin
             If ( bearCount = 0 And bullishFlip ) Or bearCount > 0 Then
                    bearCount = bearCount + 1;
       End
Else bearCount = 0;

If bearCount = 9 Then
       Begin
             DrawSymbol( Close, "Sell Setup", SymbolVerticalLine, 1, Red, Red );
             bearCount = 0;
       End;

// *** Copyright tradesignal GmbH ***
// *** www.tradesignal.com ***

****** Source Code for the BullishFlip function*******
Inputs:
       paint( TrueFalseSimple );

Vars:
       bullishPattern;

bullishPattern = Close[1] < Close[5] And Close > Close[4];

If bullishPattern And paint Then
       DrawRectangle( Date[5], Time[5], Highest( High, 5 ), Date, Time, Lowest( Low, 5 ), Red, Transparent, ToolBorder + ToolEngulfing );

BullishFlip = bullishPattern;

// *** Copyright tradesignal GmbH ***
// *** www.tradesignal.com ***


****** Source Code for the BearishFlip function*******
Inputs:
       paint( TrueFalseSimple );

Vars:
       bearishPattern;

bearishPattern = Close[1] > Close[5] And Close < Close[4];

If bearishPattern And paint Then
       DrawRectangle( Date[5], Time[5], Highest( High, 5 ), Date, Time, Lowest( Low, 5 ), DarkGreen, Transparent, ToolBorder + ToolEngulfing );

BearishFlip = bearishPattern;

// *** Copyright tradesignal GmbH ***
// *** www.tradesignal.com ***
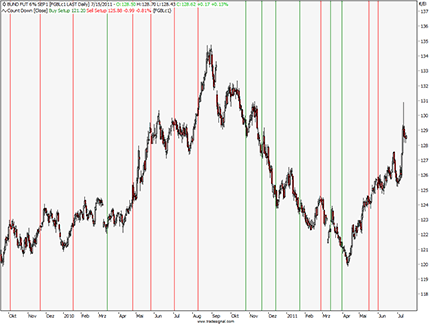
FIGURE 10: TRADESIGNAL, COUNTDOWN INDICATOR. This sample Tradesignal Online chart shows the countdown indicator on a daily chart of the German bund future.

CHARTSY: SEPTEMBER 2011
For Windows
+ Mac + Linux
This Traders’ Tip is based on Andrew Coles’ articles in the August 2011 and September 2011 issues.
The Lucas series overlay and Fibonacci series overlay described in Coles’ August 2011 article and the September 2011 Traders’ Tips Article Code overlay and Ermanometry overlay described in Coles’ article in this issue are all available as overlay plugins in Chartsy. To install the overlays, go to the Tools → Plugins → Available plugins menu, check the desired indicator, and click Install.
You can find the Java source code for the overlays at the Chartsy website. Sample charts, and the corresponding Chartsy property panels are shown in Figures 11–14.
To download Chartsy, discuss these tools, and help us develop other tools, please visit our forum at www.chartsy.org.
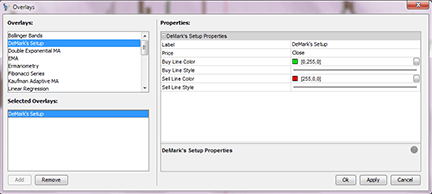
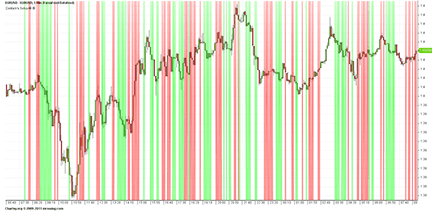
FIGURE 11: CHARTSY, September 2011 Traders’ Tips Article Code chart overlay
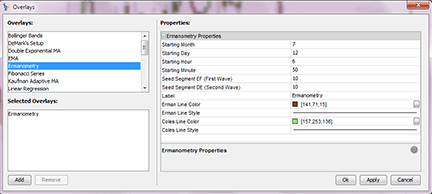
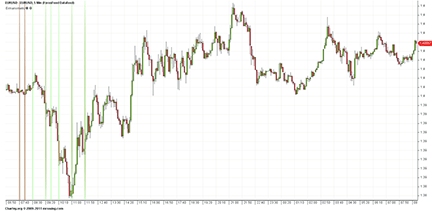
FIGURE 12: CHARTSY, ERMANOMETRY chart overlay
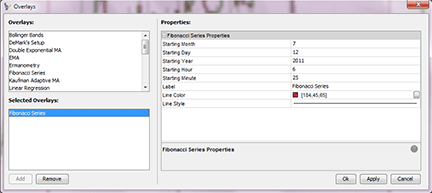
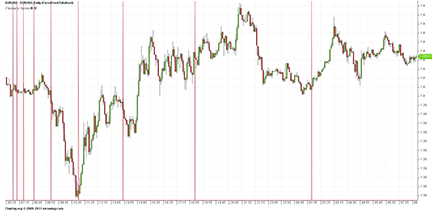
FIGURE 13: CHARTSY, FIBONACCI SERIES chart overlay
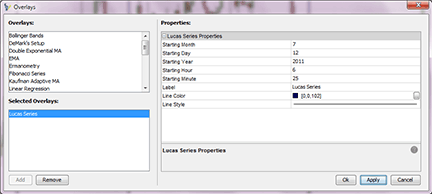
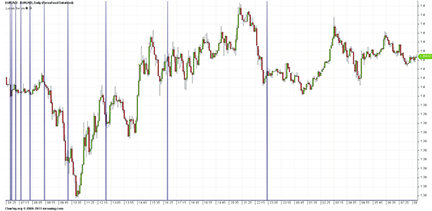
FIGURE 14: CHARTSY, LUCAS SERIES chart overlay

TRADE NAVIGATOR: SEPTEMBER 2011
You can recreate the indicators discussed in the article by Andrew Coles in this issue using Trade Navigator. (See Figure 15 for an example of setting up a function by inputting the formula.)
Here is how to create the custom indicators and add them to any chart in Trade Navigator. We will then show how to use the custom indicators to create a template that can be easily applied to any chart.
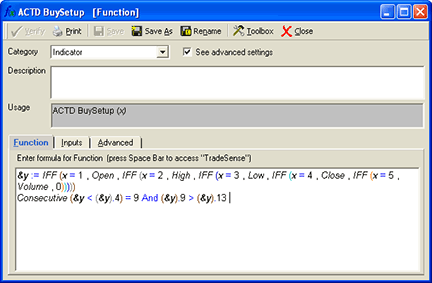
Figure 15: TRADE NAVIGATOR, ACTD Buy Setup. Here is how to set up a function in Trade Navigator.
The TradeSense code to recreate the September 2011 Traders’ Tips Article Code And Ermanometry indicators is as follows:
First, open the Trader’s Toolbox, click on the Functions tab, and click the New button.
ACTD BuySetup
Type in the following code:
&y := IFF (x = 1 , Open , IFF (x = 2 , High , IFF (x = 3 , Low , IFF (x = 4 , Close , IFF (x = 5 , Volume , 0)))))
Consecutive (&y < (&y).4) = 9 And (&y).9 > (&y).13
Click the Verify button. When you verify or save the function, you will get an Add Inputs message. Click the Add button and set the Input values:
x = 4
Click on the Save button, type a name for your new function and click OK.
ACTD SellSetup
Type in the following code:
&y := IFF (x = 1 , Open , IFF (x = 2 , High , IFF (x = 3 , Low , IFF (x = 4 , Close , IFF (x = 5 , Volume , 0)))))
Consecutive (&y > (&y).4) = 9 And (&y).9 < (&y).13
Click the Verify button. When you verify or save the function, you will get an Add Inputs message. Click the Add button and set the Input values:
x = 4
Click on the Save button, type a name for your new function and click OK.
ACTD Seq S
Type in the following code:
IFF (ACTD BuySetup (4) Or ACTD SellSetup (4) , 1 , 0)
Click on the Save button, type a name for your new function and click OK.
Ermanometry
Type in the following code:
&start := YearMonthDay = startdate
&EF := wavelength1
&DE := wavelength2
&ratio := &EF / &DE
&inverse := 1 / &ratio
&x := Bars Since (&start , 1 , 0)
&CD := &DE * &inverse
&BC := &CD * &inverse
&AB := &BC * &inverse
&FG := &EF * &ratio
&GH := &FG * &ratio
&HI := &GH * &ratio
&IJ := &HI * &ratio
&FH := SqrRoot (Power (&FG , 2) + Power (&GH , 2))

IFF (&x = Integer Part (&FH + &FG + &GH) , 1 , IFF (&x = Integer Part (&AB + &BC + &CD + &DE) , 1 , IFF (&x = Integer Part (&AB + &BC + &CD + &DE + &GH) , 1 , IFF (&x = Integer Part (&FG + &GH) , 1 , IFF (&x = Integer Part (&GH + &HI) , 1 , IFF (&x = Integer Part (&FG + &BC + &CD) , 1 , IFF (&x = Integer Part (&FG + &BC + &CD + &DE) , 1 , IFF (&x = Integer Part (&CD + &BC) , 1 , IFF (&x = Integer Part (&DE + &BC) , 1 , IFF (&x = Integer Part (SqrRoot (Power (&CD , 2) + Power (&DE , 2)) + &CD + &DE) , 1 , IFF (&x = Integer Part (SqrRoot (Power (&EF , 2) + Power (&FG , 2)) + &EF + &FG) , 1 , IFF (&x = Integer Part (&FH) , 1 , IFF (&x = Integer Part (&GH) , 1 , IFF (&x = Integer Part (&HI) , 1 , IFF (&x = Integer Part (&IJ) , 1 , IFF (&x = Integer Part (&DE + &EF + &CD) , 1 , IFF (&x = Integer Part (&GH + &HI + &IJ) , 1 , IFF (&x = Integer Part (&CD + &DE + &EF + &FG + &GH + &HI) , 1 , IFF (&x = Integer Part (&EF + &FG + &GH) , 1 , IFF (&x = Integer Part (&CD + &DE + &EF + &FG + &GH) , 1 , IFF (&x = Integer Part (&CD + &DE + &EF + &FG + &GH + &HI) , 1 , IFF (&x = Integer Part (&GH + &IJ + &CD + &AB + &EF) , 1 , 0))))))))))))))))))))))
Click the Verify button. When you verify or save the function, you will get an Add Inputs message. Click the Add button and set the Input values:
wavelength1 = 50
wavelength2 = 25
startdate = 20090526
Click on the Save button, type a name for your new function and click OK.
Creating the chart template
On a daily chart, go to the “Add to chart” window by clicking
on the chart and typing “A” on the keyboard.
Click on the Indicators tab, find the ACTD Seq S indicator in the list and either doubleclick on it or highlight the name and click the Add button.
Repeat these steps to add the Ermanometry indicator.
On the chart, click on the Ermanometry label and drag it into the price pane. Click and drag the ACTD Seq S label into the price pane.
Click on the chart and type the letter “E” to bring up the Chart Settings window. Change the indicator colors and or settings to how you want them displayed.
When you have them the way you want to see them, click OK.
Click on the Templates button on the toolbar at the top. Select <Manage chart templates>. Click the New button, type a name for the template and click OK.
You now have a template that you can apply to any chart by going to the Templates button in the toolbar and selecting the template from the list.
Genesis Financial Technologies has also provided a library that includes a template named “S&C Sept 2011 Andrew Coles” with the custom indicators discussed in Coles’ article. You can download a special file named “SC201109,” downloadable through Trade Navigator, to get this library.

VT TRADER: SEPTEMBER 2011
Our Traders’ Tip this month is based on the article by Andrew Coles in this issue. In this second part of the series, Cole discusses Thomas DeMark’s TD Sequential Setup technique (the momentum component of the TD Sequential method used to define price ranges) as well as William Erman’s Ermanometry. Coles describes how these market timing techniques can be mechanized for intraday traders.
We’ll be offering the September 2011 Traders’ Tips Article Code and Ermanometry indicators for download in our VT client forums at https://forum.vtsystems.com, along with hundreds of other precoded and free indicators and trading systems.
The VT Trader instructions for setting up these indicators are shown below.
September 2011 Traders’ Tips Article Code
- VT Trader’s Ribbon→Technical Analysis menu→Indicators group→Indicators Builder→[New] button
- In the General tab, type the following text into each corresponding
text box:
Name: TASC - 09/2011 - TD Sequential Setup
Function Name Alias: tasc_tdsequentialsetup
Label Mask: TASC - 09/2011 - TD Sequential Setup (%price%)Placement: New Frame
Data Inspection Alias: TD Sequential Setup
- In the Input Variable(s) tab, create the following variables:
[New] button...
Name: price
Display Name: Price
Type: price
Default: close
- In the Output Variable(s) tab, create the following variables:
[New] button...
Var Name: BuySetup
Name: (Buy Setup)
Line Color: blue
Line Width: slightly thicker
Line Type: histogram

[New] button...
Var Name: SellSetup
Name: (Sell Setup)
Line Color: red
Line Width: slightly thicker
Line Type: histogram
- In the Horizontal Line tab, create the following horizontal lines:
[New] button...
Value: 0
Line Color: black
Line Width: thin
Line Type: dashed
- In the Formula tab, copy and paste the following formula:
{Provided By: Capital Market Services, LLC & Visual Trading Systems, LLC} {Copyright: 2011} {Description: TASC, September 2011 - "TD Sequential and Ermanometry for Intraday Traders" by Andrew Coles, PhD} {File: tasc_tdsequentialsetup.vtscr - Version 1.0} BuySetup:= Sum(price<Ref(price,-4),9)=9 AND Ref(price,-9)>Ref(price,-13); SellSetup:= Sum(price>Ref(price,-4),9)=9 AND Ref(price,-9)<Ref(price,-13); - Click the “Save” icon in the toolbar to finish building the TD Sequential Setup indicator.
To attach the indicator to a chart click the right mouse button within the chart window and then select “Add Indicator” → “TASC - 09/2011 - TD Sequential Setup” from the indicator list.
Ermanometry
- VT Trader’s Ribbon→Technical Analysis menu→Indicators group→Indicators Builder→[New] button
- In the General tab, type the following text into each corresponding
text box:
Name: TASC - 09/2011 - Ermanometry
Function Name Alias: tasc_ermanometry
Label Mask:
TASC - 09/2011 - Ermanometry
(Start M/D/Y H:M: %sm%/%sd%/%sy% %sh%:%se%)
Data Inspection Alias: Ermanometry
- In the Input Variable(s) tab, create the following variables:
[New] button...
Name: sm
Display Name: Starting Month
Type: integer (with bounds)
Default: 1
Min Bounds: 1
Max Bounds: 12

[New] button...
Name: sd
Display Name: Starting Day of Month
Type: integer (with bounds)
Default: 1
Min Bounds: 1
Max Bounds: 31

[New] button...
Name: sy
Display Name: Starting Year
Type: integer (with bounds)
Default: 2011
Min Bounds: 1980
Max Bounds: 2100

[New] button...
Name: sh
Display Name: Hour
Type: integer (with bounds)
Default: 0
Min Bounds: 0
Max Bounds: 23

[New] button...
Name: se
Display Name: Minute
Type: integer (with bounds)
Default: 0
Min Bounds: 0
Max Bounds: 59

[New] button...
Name: EF
Display Name: Seed Segment EF (first wave)
Type: integer (with bounds)
Default: 10
Min Bounds: 1
Max Bounds: 9999

[New] button...
Name: DE
Display Name: Seed Segment DE (2nd wave)
Type: integer (with bounds)
Default: 10
Min Bounds: 1
Max Bounds: 9999

[New] button...
Name: erman
Display Name: Show Erman Series?
Type: enumeration
Default: Yes (* To set up list: click [..] button -> click [New] Button -> type "No" -> click [New] button -> type "Yes" -> click [OK] button)

[New] button...
Name: coles
Display Name: Show Coles Series?
Type: enumeration
Default: Yes (* To set up list: click [..] button -> click [New] Button -> type "No" -> click [New] button -> type "Yes" -> click [OK] button)
- In the Output Variable(s) tab, create the following variables:
[New] button...
Var Name: ErmanSeries
Name: (Erman Series)
Line Color: light green
Line Width: slightly thicker
Line Type: histogram

[New] button...
Var Name: ColesSeries
Name: (Coles Series)
Line Color: light blue
Line Width: slightly thicker
Line Type: histogram
- In the Horizontal Line tab, create the following horizontal lines:
[New] button...
Value: 0
Line Color: black
Line Width: thin
Line Type: dashed
- In the Formula tab, copy and paste the following formula:
{Provided By: Capital Market Services, LLC & Visual Trading Systems, LLC} {Copyright: 2011} {Description: TASC, September 2011 - "TD Sequential and Ermanometry for Intraday Traders" by Andrew Coles, PhD} {File: tasc_ermanometry.vtscr - Version 1.0} start:= sd=DayOfMonth() AND sm=Month() AND sy=Year() AND sh=Hour() AND se=Minute(); Ratio:= EF/DE; Inverseratio:= 1/(EF/DE); x:= BarsSince(start); CD:= DE*Inverseratio; BC:= CD*Inverseratio; AB:= BC*Inverseratio; FG:= EF*Ratio; GH:= FG*Ratio; HI:= GH*Ratio; IJ:= HI*Ratio; FH:= Sqrt(Power(FG,2)+Power(GH,2)); ErmanSeries:= erman=1 AND ( x=Int(FH) OR x=Int(GH) OR x=Int(HI) OR x=Int(IJ) OR x=Int(DE+EF+CD) OR x=Int(GH+HI+IJ) OR x=Int(CD+DE+EF+FG+GH+HI) OR x=Int(EF+FG+GH) OR x=Int(CD+DE+EF+FG+GH) OR x=Int(CD+DE+EF+FG+GH+HI) OR x=Int(GH+IJ+CD+AB+EF) ); ColesSeries:= coles=1 AND ( x=Int(FH+FG+GH) OR x=Int(AB+BC+CD+DE) OR x=Int(AB+BC+CD+DE+GH) OR x=Int(FG+GH) OR x=Int(GH+HI) OR x=Int(FG+BC+CD) OR x=Int(FG+BC+CD+DE) OR x=Int(CD+BC) OR x=Int(DE+BC) OR x=Int(Sqrt(Power(CD,2)+Power(DE,2))+CD+DE) OR x=Int(Sqrt(Power(EF,2)+Power(FG,2))+EF+FG) ); - Click the “Save” icon in the toolbar to finish building the Ermanometry indicator.
To attach the indicator to a chart, click the right mouse button within the chart window and then select “Add Indicator” → “TASC - 09/2011 - Ermanometry” from the indicator list.
Sample charts of the September 2011 Traders’ Tips Article Code and Ermanometry indicator are shown in Figures 16 and 17.
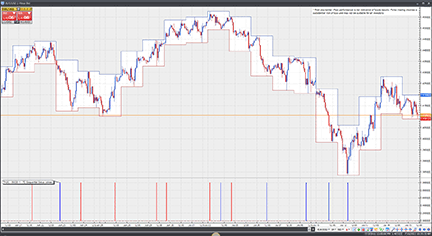
FIGURE 16: VT TRADER, September 2011 Traders’ Tips Article Code. Here is the September 2011 Traders’ Tips Article Code attached to a EUR/USD one-hour candle chart.
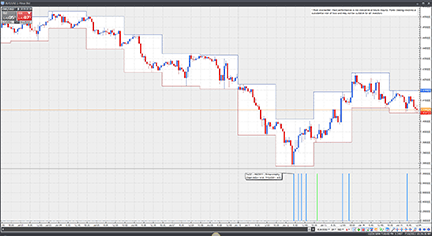
FIGURE 17: VT TRADER, Ermanometry. Here is the Ermanometry indicator attached to a EUR/USD one-hour candle chart.
To learn more about VT Trader, visit www.vtsystems.com.
Risk disclaimer: Forex trading involves a substantial risk of loss and may not be suitable for all investors.
MICROSOFT EXCEL: SEPTEMBER 2011
This month, author Andrew Coles continues his exploration of time series-based market studies with Ermanometry-based intervals and September 2011 Traders’ Tips Article Code in this issue.
In this Excel example, I have once again used data for Tlt as I did for the August 2011 Traders’ Tip so we can compare the results. This example is coded to use the closing price, but provisions have been made to allow you to base the calculations on open, high, low, or close, similar to the MetaStock code given in Coles’ article.
In Excel terms, the only real difference between intraday, daily, weekly, or longer time frames is how one goes about specifying the bars that define segments DE and EF for the Erman study. The September 2011 Traders’ Tips Article Code does not require a start date.
In Figure 18, the Erman left, middle, and right plots mark the ends of the ratio defining segments DE and EF chosen for this example. The spreadsheet is coded to start the Ermanometry counts and plots at the Erman right bar.
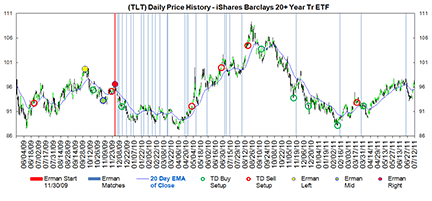
Figure 18: EXCEL, September 2011 Traders’ Tips Article Code and Ermanometry. The Erman left, middle, and right plots mark the ends of the ratio defining segments DE and EF chosen for this example. The spreadsheet is coded to start the Ermanometry counts and plots at the Erman right bar.
If you have access to historical intraday data, the notes tab outlines the simple cell format changes you would need to make to use this workbook with intraday data.
This workbook incorporates the chart data windowing ability I introduced in previous Excel Traders’ Tips. To take advantage of this feature you will need to enable Vba macro content when prompted.
Even if you choose not to enable Vba macro content, you may view the macros after you open the spreadsheet by using Alt-F11 to open the Vba integrated development environment.

METASTOCK — COLES
ARTICLE CODE — SEPTEMBER 2011
A TD Sequential buy Setup adheres to the following two conditions:
- A bearish price flip whereby price must close higher than the close four bars earlier, followed by a close less than the close four bars earlier
- Nine consecutive closes, each one less than the corresponding close four bars earlier (where the bar on which the bearish price flip occurs qualifies as bar of the buy Setup).
For a sell Setup, these conditions are reversed. These two conditions can be programmed into MetaStock and the result is a mechanized version of the September 2011 Traders’ Tips Article Code.
Metastock code for intraday application of the September 2011 Traders’ Tips Article Code
x:=Input("Price Field, 1=O,2=H,3=L,4=C,5=V",1,5,4);
y:=If(x=1,O,If(x=2,H,If(x=3,L,If(x=4,L,If(x=5,V,0)))));

{BuySetup}
Sum(y<Ref(y,-4),9)=9 AND {initialization} Ref(y,-9)>Ref(y,-13);

{SellSetup}
Sum(y>Ref(y,-4),9)=9 AND {initialization} Ref(y,-9)<Ref(y,-13);
Metastock code for intraday application of Ermanometry
sm:=Input("starting month",1,12,1);
sd:=Input("starting day of month",1,31,1);
sh:=Input("hour", 1,24,1);
se:=Input("minute",0,60,0);

start:= sd=DayOfMonth() AND sm=Month() AND 2010 AND sh=Hour() AND se=Minute();

EF:=Input("seed segment EF (first wave)",1,900,10) {first leg or movement};
DE:=Input("seed segment DE (second wave)",1,900,10) {second leg or movement};

Ratio:=EF/DE;

Inverseratio:= 1/(EF/DE);

x:=BarsSince(start);

CD:=DE*Inverseratio;
BC:=CD*Inverseratio;
AB:=BC*Inverseratio;
FG:= EF*Ratio;
GH:=FG*Ratio;
HI:=GH*Ratio;
IJ:=HI*Ratio;

FH:= Sqrt(Power(FG,2)+Power(GH,2));

{start of calculations}

If(x=Int(FH),1,0); {Erman}
If(x=Int(GH),1,0); {Erman}
If(x=Int(HI),1,0); {Erman}
If(x=Int(IJ),1,0); {Erman}
If(x=Int(DE+EF+CD),1,0); {Erman}
If(x=Int(GH+HI+IJ),1,0); {Erman}
If(x=Int(CD+DE+EF+FG+GH+HI),1,0); {Erman}
If(x=Int(EF+FG+GH),1,0); {Erman}
If(x=Int(CD+DE+EF+FG+GH),1,0); {Erman}
If(x=Int(CD+DE+EF+FG+GH+HI),1,0); {Erman}
If(x=Int(GH+IJ+CD+AB+EF),1,0); {Erman}
FH:= Sqrt(Power(FG,2)+Power(GH,2));

If(x=Int(FH+FG+GH),1,0); {Coles}
If(x=Int(AB+BC+CD+DE),1,0); {Coles}
If(x=Int(AB+BC+CD+DE+GH),1,0); {Coles}
If(x=Int(FG+GH),1,0); {Coles}
If(x=Int(GH+HI),1,0); {Coles}
If(x=Int(FG+BC+CD),1,0); {Coles}
If(x=Int(FG+BC+CD+DE),1,0); {Coles}
If(x=Int(CD+BC),1,0); {Coles}
If(x=Int(DE+BC),1,0); {Coles}
If(x=Int(Sqrt(Power(CD,2)+Power(DE,2))+CD+DE),1,0); {Coles}
If(x=Int(Sqrt(Power(EF,2)+Power(FG,2))+EF+FG),1,0); {Coles}

BLOOMBERG: SEPTEMBER 2011
In his article in this issue, author Andrew Coles demonstrates additional techniques following his article last month, this time focused on intraday trading using sequences of spikes on the chart to represent the development of a linear rectangular spiral, as well as the TD Sequential developed by Tom DeMark.
The TD Sequential indicator is available as part of the DeMark suite of indicators offered as a third-party subscription service accessible through DEMA<GO>.
The spikes on the 60-minute Citigroup chart shown in Figure 19 formed by the Ermanometry study, as described in Coles’s article, are based on the two significant moves in the beginning of June 2010. The downward slope consists of 90 bars, and the move back up has a count of 40 bars. Using these inputs, the spikes are created and, as is shown, line up with a number of meaningful times in the market. The first three green circles all line up with points where the market was not following the overall uptrend that ran from mid-June until reversing in early/mid July. The furthest spike on the chart lines up (within three bars, as mentioned in Coles’s article) with what appears to be the end of the downmove.
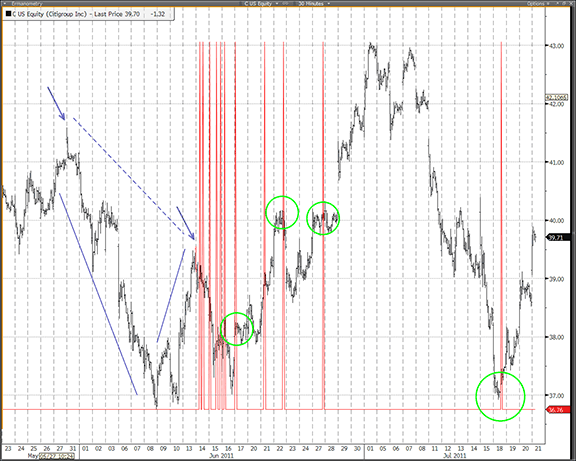
FIGURE 19: BLOOMBERG, ERMANOMETRY. This 30-minute chart of Citigroup shows a down move from June 1 through June 8, 2011, consisting of 90 bars. The move up from the low on June 8 hit a swing high on June 13 with a count of 40 bars. Using these numbers with Ermanometry, as described in this month’s article by Andrew Coles, produces spikes on the chart often corresponding with prominent points of trend pausing and reversal.
As with the Fibonacci and Lucas sequences discussed in last month’s Bloomberg Traders’ Tip, this indicator was written to paint the bar that is clicked on as the beginning point for the count. Using the CS.NET framework within the STDY<GO> function on the Bloomberg Terminal, C# or Visual Basic code can be written to display the spikes resulting from Ermanometry sequences, as described in Coles’s article in this issue.
The C# code for this indicator is shown below. All Bloomberg code contributions to Traders’ Tips can also be found in the sample files provided with regular SDK updates, and the studies will be included in the Bloomberg global study list.
using System;
using System.Collections.Generic;
using System.Text;
using System.Drawing;
using Bloomberg.Study.API;
using Bloomberg.Study.CoreAPI;
using Bloomberg.Study.Util;
using Bloomberg.Study.TA;
using Bloomberg.Math;

namespace Ermanometry
{

    public partial class Ermanometry
    {
        // DateTime to hold the starting point for the sequence
        DateTime startPoint;

        public StudyIntegerProperty DE = new StudyIntegerProperty(10, 40, 900);
        public StudyIntegerProperty EF = new StudyIntegerProperty(10, 48, 900);

        private void Initialize()
        {
            // Create Lines to Output at Ermonetric Counts
            Output.Add("Ermanometry", new TimeSeries());
            StudyLine ErmanometryLine = new StudyLine("Ermanometry", Color.Red);
            ErmanometryLine.Style = LineStyle.Solid;
            ErmanometryLine.Width = 1;
            ParentPanel.Visuals.Add("ErmanometricCount", ErmanometryLine);

            // Create Paint Bar to mark start point of Ermonetric Count
            Output.Add("PaintBar", new TimeSeries());
            StudySignal paintBar = new StudySignal("PaintBar");
            paintBar.Marker = new PaintBar(Color.Cyan);
            ParentPanel.Visuals.Add("PaintBar", paintBar);

            // Register callback function for handling chart click to set a new start point
            Notifications.Add("Ermanometry Start", new StudyIndexNotification(ermStartCallback));
        }


        public override void Calculate()
        {
            // Find the min and max value of the chart data for plotting the needle projections
            double minValue = Input.Low.Minimum;
            double maxValue = Input.High.Maximum;

            int count = Input.Close.Count;
            TimeSeries paintBarData = new TimeSeries(count);
            TimeSeries ermanometricData = new TimeSeries(count, minValue);

            // This section will tie the color of the Paint Bar (clicked bar) to the color of the
            // Ermanometry Lines
            StudyLine line = ParentPanel.Visuals["ErmanometricCount"] as StudyLine;
            StudySignal signal = ParentPanel.Visuals["PaintBar"] as StudySignal;
            PaintBar paintBar = signal.Marker as PaintBar;
            paintBar.Color = line.Color;
            line.ShowValues(false);  // This stops the needle projections from showing a value in the
                                     // chart legend

            // Intialize the start point to the beginning of the chart
            if (startPoint == null)
            {
                startPoint = Input.DateTimes[0];
            }

            // Find the starting point of the sequence based on the selected DateTime
            int startIndex = 0;
            while (startIndex < Input.Close.Count && Input.DateTimes[startIndex] < startPoint)
            {
                startIndex++;
            }

            // Mark the starting point with a paintBar
            paintBarData[startIndex] = 1;

            double Ratio = (double)EF.Value / (double)DE.Value;
            double Inverseratio = 1 / Ratio;

            int CD = (int)Math.Round(DE.Value * Inverseratio);
            int BC = (int)Math.Round(CD * Inverseratio);
            int AB = (int)Math.Round(BC * Inverseratio);
            int FG = (int)Math.Round(EF.Value * Ratio);
            int GH = (int)Math.Round(FG * Ratio);
            int HI = (int)Math.Round(GH * Ratio);
            int IJ = (int)Math.Round(HI * Ratio);

            double FH = Math.Sqrt(Math.Pow(FG, 2) + Math.Pow(GH, 2));

            for (int ii = 0; ii < count; ii++)
            {
                double x = ii - startIndex;

                if (x == (int)FH) ermanometricData[ii] = maxValue; //Erman
                if (x == (int)GH) ermanometricData[ii] = maxValue; //Erman
                if (x == (int)HI) ermanometricData[ii] = maxValue; //Erman
                if (x == (int)IJ) ermanometricData[ii] = maxValue; //Erman
                if (x == (int)DE.Value + EF.Value + CD) ermanometricData[ii] = maxValue; //Erman
                if (x == (int)GH + HI + IJ) ermanometricData[ii] = maxValue; //Erman
                if (x == (int)CD + DE.Value + EF.Value + FG + GH + HI) ermanometricData[ii] = maxValue;
                //Erman
                if (x == (int)EF.Value + FG + GH) ermanometricData[ii] = maxValue; //Erman
                if (x == (int)CD + DE.Value + EF.Value + FG + GH) ermanometricData[ii] = maxValue; //Erman
                if (x == (int)CD + DE.Value + EF.Value + FG + GH + HI) ermanometricData[ii] = maxValue;
                //Erman
                if (x == (int)AB + BC + GH-1) ermanometricData[ii] = maxValue; //Erman
                if (x == (int)GH + IJ + CD + AB + EF.Value) ermanometricData[ii] = maxValue; //Erman
                FH = Math.Sqrt(Math.Pow(FG, 2) + Math.Pow(GH, 2));

                if (x == (int)FH + FG + GH) ermanometricData[ii] = maxValue; //Coles
                if (x == (int)AB + BC + CD + DE.Value) ermanometricData[ii] = maxValue; //Coles
                if (x == (int)AB + BC + CD + DE.Value + GH) ermanometricData[ii] = maxValue; //Coles
                if (x == (int)FG + GH) ermanometricData[ii] = maxValue; //Coles
                if (x == (int)GH + HI) ermanometricData[ii] = maxValue; //Coles
                if (x == (int)FG + BC + CD) ermanometricData[ii] = maxValue; //Coles
                if (x == (int)FG + BC + CD + DE.Value) ermanometricData[ii] = maxValue; //Coles
                if (x == (int)CD + BC) ermanometricData[ii] = maxValue; //Coles
                if (x == (int)DE.Value + BC) ermanometricData[ii] = maxValue; //Coles
                if (x == (int)(Math.Sqrt(Math.Pow(CD, 2) + Math.Pow(DE.Value, 2)) + CD + DE.Value))
                    ermanometricData[ii] = maxValue; //Coles
                if (x == (int)(Math.Sqrt(Math.Pow(EF.Value, 2) + Math.Pow(FG, 2)) + EF.Value + FG))
                    ermanometricData[ii] = maxValue; //Coles
            }

            Output.Update("Ermanometry", ermanometricData);
            Output.Update("PaintBar", paintBarData);
        }

        // This is inserted to allow user to click on starting bar instead of manually inputting date and time
        public void ermStartCallback(int index)
        {
            // Reset the startPoint to the DateTime of the selected bar
            startPoint = Input.DateTimes[index];
            // Force the study to recalculate based on the new start point
            Calculate();
        }

    }

}
The computer code published on this webpage and in the September 2011 issue of this publication reflects the efforts of third parties to code the indicators discussed in the following article, published in the September 2011 issue of Technical Analysis of Stocks & Commodities: Andrew Coles, ‘TD Sequential and Ermanometry for Intraday Traders.’ The code published on this webpage or in the September 2011 issue of Stocks & Commodities is not sponsored or endorsed by, nor affiliated in any manner whatsoever with, Thomas DeMark or his company, Market Studies LLC, and it should not be confused with any indicator, software, product or service that he or his company may offer, or license others to offer, for purchase or licensing.