CYCLES
A Timely Edge With The S&P 500
Weekly And Monthly Seasonal Cycles
These two short-term seasonal cycles can give traders an edge.
In recent years, making use of the seasonal cycles of various stocks and commodities have become a popular trading technique. For example, “Sell in May and go away” is a popular saying among equity traders, reflecting the tendency of the Standard & Poor’s 500 to experience weakness during the summer months. The “Santa Claus rally” is another example of the yearly seasonal cycle of stocks, reflecting how traders can make use of the year-end market activity.
However, the yearly seasonal cycle is only one of a few that are anchored on dates, and which make up the broader category of seasonals. Here are two short-term seasonal cycles that can provide an edge to traders, using the weekly and monthly seasonal cycles in the S&P 500.
On the edge
A good starting point to measure the seasonal edge of a particular trading day is to test the average move of any day during a period. Figure 1 shows the average move in the S&P 500 for every day in the period from February 1, 2001, to February 1, 2011. These are the figures against which all other day-to-day moves should be measured against. Only if a day is up more than 53.4% of the time or offers a better than 1.01 reward-risk ratio can it be said to provide an edge for long trades.

Figure 1: Average Day Result (February 1, 2001–February 1, 2011). These are the figures against which all other day-to-day moves should be measured against. Only if a day is up more than 53.4% of the time or offers a better than 1.01 reward-risk ratio can it be considered to provide an edge for long trades.
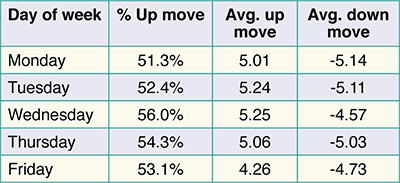
Figure 2 shows the magnitude of day-to-day moves in the S&P 500, measured close-to-close from February 1, 2001 to February 1, 2011. During this exceptionally volatile 10-year period, every day of the week had a better than even chance of being an up day. In particular, Wednesday not only had the highest likelihood of being an up day, it also had the best reward-risk ratio at 1.15. In addition, Mondays and Fridays are the only days with unfavorable reward-risk ratios for long trades, although neither Tuesday nor Thursday is exceptionally favorable.

Figure 2: Day of Week Results (February 1, 2001–February 1, 2011). Every day of the week had a better than even chance of being an up day. Wednesday has the highest likelihood of being an up day and has the best reward-risk ratio at 1.15. Mondays and Fridays are the only days with unfavorable reward-risk ratios for long trades, although neither Tuesday nor Thursday is exceptionally favorable.