INDICATORS
Predicting The Next Index Move
The Put/Call Ratio And Price Cycles
The put/call ratio and open interest can be used as a leading indicator to predict the next index move. In this, the first part of a three-part series, the put/call ratio is defined and the cyclical phases this indicator goes through.
I started writing my first book near the end of the previous century. That sounds like such a long time ago! It was only published in Flemish, my native language. A small part was about fundamental analysis, the main part was about technical analysis, and there was an introduction to option strategies. In the part about option strategies, based on the put/call ratio and the open interest, I wrote about my idea of how these two parameters could be used as a leading indicator to predict the next index move.
For a couple of years afterward, I published followup commentary and accompanying data from the European Options Exchange (Eoe). Unfortunately, at some point this data stopped being offered anywhere I looked for it and I had to abandon that project, much to my regret.
Then in early 2010, I noticed that the put/call ratio of all the Cboe equity options is available at the Cboe website (https://www.cboe.com/data/PutCallRatio.aspx). There, you can find the Cboe equity put/call ratio data from October 21, 2003. That made me think about my earlier work.
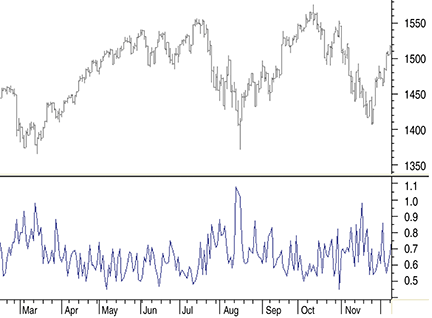
An indicator that uses the put/call ratio has an advantage in that it is not based on the usual price or volume data, and as such, it can be an interesting extra piece of independent price information. Looking at Figure 1, however, where you see a chart of the Standard & Poor’s 500 at the top with the raw put/call ratio data at the bottom, it is evident that we will need some tricks to create a usable indicator.

Figure 1: the s&p 500 with the raw put/call ratio. How can you make the put/call ratio a usable indicator?