CHARTING
The Simpler They Are?
The Eight Best-Performing Candles
After removing rare candlesticks and combining reversal or continuation rates with performance after 10 days, surprising winners emerge.
Those of you well versed in candlesticks will find this article surprising. It describes how single-line candles can lead to the best performance. In an earlier article, I discussed investment-grade candles, those that performed best as reversal or continuation patterns. In another article, I discussed candles that led to strong moves 10 days later. This article combines those two qualities and adds a third filter that removes rare candles to uncover the eight best-performing candles overall.
Definitions and methodology
Describing my testing methodology is necessary so everyone understands my measurement technique. I looked at more than 4.7 million price bars (candle lines) to identify and track 103 candle patterns. A close above the top of a candle represents an upward breakout. Similarly, a close below the bottom of the candle pattern is a downward breakout. That’s true of most candle patterns except for unusually tall ones, such as eight or 13 new price lines, where I used the last price bar upon which to conduct the up or down breakout test.
If price entered the candlestick from the bottom but exited out the top, it acted as a continuation. Similarly, if it exited in the same direction that it entered (entering from above and exiting upward, for example), the candle acted as a reversal.
To exclude rare candles, I ranked the frequency of each candle found in the same database (500 stocks of 10 years’ duration). I split the frequency rank in half and threw out the rare ones (the rare half).
To find which candles had the best overall performance, I started with the plentiful candles, measured and ranked the reversal or continuation rates, added a rank for the price move after 10 days, and ranked the result. The idea was to find candles that performed best as reversal or continuation patterns, trended far enough in the breakout direction to make money, and appeared often enough to be identified. Here, I describe the top two candles in each category.

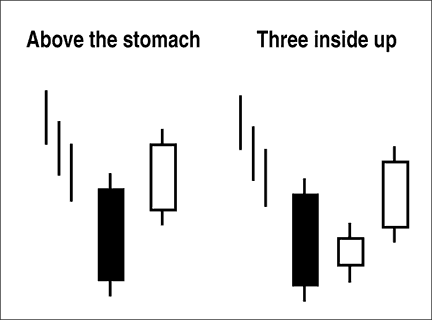
Figure 1: bullish reversals. Here you see the top two-performing candlestick patterns that act as bullish reversals.