CHARTING
Powerful, Yet Often Misread
Three Peaks And A Domed House
Predicting and timing the tops of bull markets — both cyclical and secular — can be accomplished using this well-known pattern developed by George Lindsay.
Despite 25 years of newsletters, the methods of George Lindsay have always been a bit of a mystery. Appearances on the television program Wall $treet Week With Louis Rukeyser in the 1980s, numerous references in The New York Times during the 1960s and 1970s, and 10 years of performance tracking by Stock Trader’s Almanac have not been enough to offset Lindsay’s failure to write a book describing his unique but prescient methodologies. Everything we know about his work is from the scattered collection of the remaining newsletters we were able to recover.
The pattern
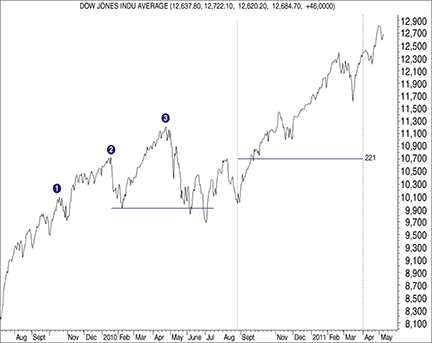
Probably the best-known concept Lindsay developed is the three peaks and a domed house (3PDh). A fairly simple yet powerful geometric pattern, the 3PDh formation has an admirable track record for both predicting and timing the tops of bull markets — both cyclical and secular. Many traders and analysts use this pattern in isolation, as it is often effective as a standalone forecasting tool.
George Lindsay, however, saw this model as a tool to be integrated with his other, less-known models. We saw in April 2011 how using the 3PDh pattern in isolation caused some grief among traders when many using the pattern saw it pointing to a final top to the March 2009 bull market. If those traders had been aware of how the 3PDh formation fit into Lindsay’s other models, they would not have made that mistake, as any April target date they had derived from the model had clearly been eliminated by those other models.

Figure 1: three peaks and a domed house with april target. The distance between peaks 1 and 3 meet Lindsay’s minimum measurement of six months. Peak 3 is then followed by the separating decline.