MONEY MANAGEMENT
Variations On A Classic
Identifying Stops And Targets
How do you figure out where to place stops and targets? Try using support and resistance levels together with the average true range.
As a broker, I am often asked how to figure out where to place stops and targets. There are, of course, many different methods, ranging from not using them at all to using volatility-based figures. One of the most reliable is the use of support and resistance coupled with the average true range (Atr). I will demonstrate this principle using multiple time frames with two unrelated markets to show how truly universal it can be.
First of all, we must define support and resistance. The most basic understanding of support is a level where prices fail to make new lows. The opposite — the failure to make new highs — is true for resistance. They can be thought of as floors and ceilings.
Support as stop-loss
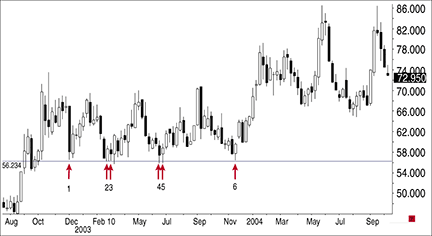
Figure 1 is a weekly coffee chart. Once the market makes a double low (points 1 and 2), we can use that as a temporary level of support. Observe how the market retraces at points 3, 4, 5, and 6 before it moves away for good. Often, the exact level (56.234) at which the dotted line is drawn is inconsequential relative to any major price points — in this case, 56.000 — when setting a stop-loss.

Figure 1: weekly coffee chart. Here you see where the support level is. You can assume that trades at or around 56.000 will serve as entry and exit points in both directions.
There is no guarantee that stop orders will be filled at the trader’s preferred price. Once the stop order has been triggered, it turns into a market order, which is then filled at the best possible price. The fill price may be higher or lower than the price specified by the stop order.
The reason we move down to the next major number is because of a phenomenon known as “group think.” We can assume that most traders think alike and can identify support and resistance just as easily as the next guy. The difference, though, is that traders have different motivations for buying and selling and generally have strong and opposing convictions for the market’s direction. Therefore, you can assume that trades at or around 56.000 will serve as entry and exit points in both directions for many traders.