INDICATORS
Is The Drunkard Still Walking?
The Random Walk Revealed
Most indicators are correlated to the cyclical movements of the market. Here is an indicator that can identify trends without considering where in the cycle the market is located.
Nearly all technical indicators depend upon the ever-changing cyclic content of the market to generate information. When the indicator is synchronized with the current market cycle, the signals are timely. If the indicator is misaligned, however, the signals will be out of phase and thus useless. When it was first proposed, the random walk index was an attempt to generate cycle-free trend identification. Here’s a look at what the random walk really is, how it fits with other indicators, and an expanded trading diary to show how it works.
Background
In the early 1990s, E. Michael Poulos wrote a series of articles for Stocks & Commodities in which he introduced the random walk index. The concept was borrowed from the probability theorist and teacher William Feller, wherein it was referred to as a “drunkard’s walk.” In his honor, I will refer to my material thus.
Feller posed the question, “If a drunk leaves the lamp post he is leaning against, how far would he have gone, on average, after n steps?” The answer is he would have gone the square root of n multiplied by the average length of his stride:
√n * Average length of stride
Using this solution, Poulos constructed his random walk index by creating an up walk and a down walk, then comparing them against each other and with a random walk.
The up walk is constructed by subtracting the lowest price of the last n periods from the current high. Let’s call that “up distance.” Count the number of periods from that low point to now.

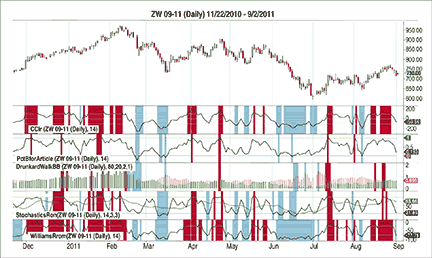
Figure 1: overbought/oversold indicators. All overbought (red)/oversold (cyan) indicators find much the same tops/bottoms.