TRADING SYSTEMS
Test Your Results
Walk-Forward Evaluation
When you design a trading system, you want to see an extensive set of walk-forward tested results. Here’s how you can do that.
Every system trader wants to see a healthy set of historically backtested results that will engender a sense of confidence before they begin to consider trading a given system with real money. But the truly savvy system trader will also want to see an extensive amount of forward-tested results from the same system using previously unseen data. A trading system that passes muster in both back- and forward-test mode (also known as “in sample” and “out of sample” [OOS] modes, respectively) has a far more promising future in the real world of trading than one that simply looks good when backtested over historical data. Every serious system trader should demand that both sets of test data be made available to them before they fork over their hard-earned money for any system, no matter who the developer is.
In Figure 1 you see the forward-tested results for an emini stock index futures trading system that I developed last year. I originally tested it on six months of historical data and after fine-tuning it, I decided to run it in forward-test mode for the long haul to see if the underlying market concept of the system was truly valid.
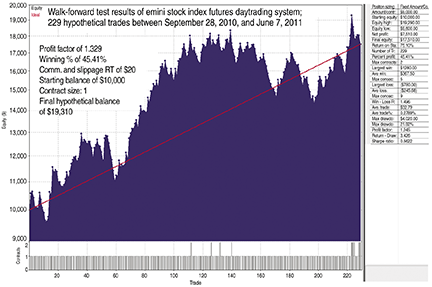
FIGURE 1: FORWARD-TESTED RESULTS. There were 229 hypothetical trades between September 28, 2010, and June 7, 2011. After a lengthy period of drawdowns and choppiness, the system did prove itself. But is this the right system for you?
To do so, at the close of each trading session (0930 to 1600 Eastern time, Monday through Friday) I manually entered the trades into Adaptrade’s Market System Analyzer (MSA) using the commission, slippage, contract size, and starting balance you see on the chart in Figure 1. It was been a long and grueling test, but after 229 trades in OOS mode, it appears that the system has proved itself, and despite having endured some lengthy periods of drawdown and sideways choppiness, it has gone on to make new equity highs in recent trading action.
Now, before you decide that this is the trading system that will do the job for you, ask yourself a few difficult questions with as much honesty as you can muster — because you’re only fooling yourself if you aren’t honest with yourself:
- If you had begun trading this system on February 24, 2011 (the day after the highest value in the equity curve [$19,370] was reached — prior to the new high of June 1, 2011, that is), could you have stayed with the system through the ensuing 18.7% drawdown (one that endured for 57 trades) that lasted until May 5, 2011? The dollar amount of the drawdown was $3,630. Would you still be hot to trade a system after it’s had a long streak of any kind?