TRADERS’ TIPS
January 2012
Here is this month’s selection of Traders’ Tips, contributed by various developers of technical analysis software to help readers more easily implement some of the strategies presented in this and other issues.
Other code appearing in articles in this issue is posted in the Subscriber Area of our website at https://technical.traders.com/sub/sublogin.asp. Login requires your last name and subscription number (from mailing label). Once logged in, scroll down to beneath the “Optimized trading systems” area until you see “Code from articles.” From there, code can be copied and pasted into the appropriate technical analysis program so that no retyping of code is required for subscribers.
You can copy these formulas and programs for easy use in your spreadsheet or analysis software. Simply “select” the desired text by highlighting as you would in any word processing program, then use your standard key command for copy or choose “copy” from the browser menu. The copied text can then be “pasted” into any open spreadsheet or other software by selecting an insertion point and executing a paste command. By toggling back and forth between an application window and the open web page, data can be transferred with ease.
This month’s tips include formulas and programs for:
- TRADESTATION: REVERSING MACD
- METASTOCK: REVERSING MACD
- THINKORSWIM.COM: REVERSING MACD
- eSIGNAL: REVERSING MACD
- WEALTH-LAB: REVERSING MACD
- NEUROSHELL TRADER: REVERSING MACD
- AIQ: REVERSING MACD
- TRADERSSTUDIO: REVERSING MACD
- TRADINGSOLUTIONS: REVERSING MACD
- TRADECISION: REVERSING MACD
- NINJATRADER: REVERSING MACD
- TRADESIGNAL: REVERSING MACD
- UPDATA: REVERSING MACD
- SHARESCOPE: REVERSING MACD
- MICROSOFT EXCEL: REVERSING MACD
- AMIBROKER: REVERSING MACD — DOUGH ARTICLE CODE

TRADESTATION: REVERSING MACD
In “Reversing MACD” by Johnny Dough in this issue, Dough describes the construction of two indicators: one for the price chart and another for the indicator panel.
The chart indicator is designed to plot prices on the next bar that will result in an MACD value equal to the value on the current bar and the price level that will result in an MACD value of zero on the next bar.
The second indicator plots MACD in the indicator panel beneath price.
Both indicators include multiple variations of the values that are plotted (see Dough’s article for the different variations).
Here, we present indicator code for both indicators (“_PMACD_Ind1” is for the subgraph with price data and “_PMACD_Ind2” is for a subgraph below price data), along with the supporting functions
.The “PlotTemplate” input in each indicator is used to determine which plots are displayed (notes were added to the code to cross-reference the PlotTemplate number with the author’s plot names).
Also included is strategy code for illustration only. The strategy uses the MACD value and the upper and lower Bollinger Bands for entry and exit.
_PMACD_Ind1 (Indicator for Price Sub-Graph)
{ TASC January 2012 }
{ Reversing MACD by Johnny Dough }

inputs:
	PlotTemplate( 1 ), { 1 = PMACD, 2 = PMACD_HLC,
	 3 = PMACD_BB, 4 = PMACD_MTF }
	PMACDPrice( Close ), { price used for PMACDeq }
	P_Fast( 12 ),
	P_Slow( 26 ),
	P_Signal( 9 ), { PMACDeq EMA Signal length }
	PMACD_TF_Mult1( 5 ), { length multiplier for
	 higher TF }
	PMACD_TF_Mult2( 21 ), { length multiplier for
	 higher TF }
	p_bbperiod( 10 ), { BB average length }
	p_bbwidth( 1 ), { BB # of standard deviation }
	Displace( -1 ) ; { plot displacement }

variables:
	PMACDeq( 0 ),
	PMACDeqSignal( 0 ),
	PMACDeq_TF1( 0 ),
	PMACDeq_TF2( 0 ),
	PMACDzero( 0 ),
	UpperBand( 0 ),
	LowerBand( 0 ) ;

PMACDzero = _PMACDzero( PMACDPrice, P_Fast, P_Slow ) ;

{ Plots }
if PlotTemplate <> 2 then
	begin
	PMACDeq = _PMACDeq( PMACDPrice, P_Fast, P_Slow ) ;
	Plot1[Displace]( PMACDeq, "PMACDeq" ) ;
	end ;

Plot2[Displace]( PMACDzero, "PMACDzero" ) ;

if PlotTemplate = 2 then
	begin
	Plot3( _PMACDeq( High, P_Fast, P_Slow ),
	 "PMACD H" ) ;
	Plot4( _PMACDeq( Close, P_Fast, P_Slow ),
	 "PMACD C" ) ;
	Plot5( _PMACDeq( Low, P_Fast, P_Slow ),
	 "PMACD L" ) ;
	end ;

if PlotTemplate = 1 then
	begin
	PMACDeqSignal = XAverage( PMACDeq, P_Signal ) ;
	Plot6[Displace]( PMACDeqSignal, "PMACDeqSig" ) ;
	end ;

if PlotTemplate = 3 then
	begin
	UpperBand = BollingerBand( PMACDeq, p_bbperiod,
 	 p_bbwidth ) ;
	LowerBand = BollingerBand( PMACDeq, p_bbperiod,
 	 -p_bbwidth ) ;
	Plot7[Displace]( UpperBand, "UpperBand" ) ;
	Plot8[Displace]( LowerBand, "LowerBand" ) ;
	end ;

if PlotTemplate = 4 then
	begin
	PMACDeq_TF1 = _PMACDeq( PMACDPrice, P_Fast *
	 PMACD_TF_Mult1, P_Slow * PMACD_TF_Mult1 ) ;
	PMACDeq_TF2 = _PMACDeq( PMACDPrice, P_Fast *
	 PMACD_TF_Mult2, P_Slow * PMACD_TF_Mult2 ) ;
	Plot9[Displace]( PMACDeq_TF1, "PMACDeqTF1" ) ;
	Plot10[Displace]( PMACDeq_TF2, "PMACDeqTF2" ) ;
	end ;

_PMACD_Ind2 (Indicator for Sub-Graph Below Price)

{ TASC January 2012 }
{ Reversing MACD by Johnny Dough }
{ This indicator is designed to be inserted below
  Price }

inputs:
	PlotTemplate( 1 ), { 1 = MACD, 2 = MACD_HLC,
	 3 = MACD_BB, 4 = MACD_MTF }
	Price( Close ),
	FastLength( 12 ),
	SlowLength( 26 ),
	MACDLength( 9 ),
	BBAvgLen( 10 ),
	BBStdDev( 1 ),
	MACD_TF_Mult1( 5 ),
	MACD_TF_Mult2( 21 ) ;

variables:
	NumDecimals( Log( PriceScale ) / Log( 10 ) ),
	MyMACD( 0 ),
	MyMACD_TF1( 0 ),
	MyMACD_TF2( 0 ),
	MACDAvg( 0 ),
	MACDBBAvg( 0 ),
	MACDDiff( 0 ),
	string String1( "" ),
	string String2( "" ),
	UpperBand( 0 ),
	LowerBand( 0 ) ;

if PlotTemplate <> 2 then
	begin
	MyMACD = MACD( Price, FastLength, SlowLength ) ;
	Plot1( MyMACD, "MACD" ) ;
	Plot12( MyMACD, "MACDDots" ) ;
	end ;

if PlotTemplate = 1 then
	begin
	MACDAvg = XAverage( MyMACD, MACDLength ) ;
	MACDDiff = MyMACD - MACDAvg ;

	Plot2( MACDAvg, "MACDAvg" ) ;
	Plot3( MACDDiff, "MACDDiff" ) ;
	end ;

if PlotTemplate = 1 or PlotTemplate = 4 then
	begin
	String1 = "Next_PMACDeq = " + NumToStr( _PMACDeq(
	 Price, FastLength, SlowLength ), NumDecimals ) ;
	Plot13( String1 ) ;

	String2 = "Next_PMACDzero = " +
	 NumToStr( _PMACDzero( Price, FastLength,
	  SlowLength ), NumDecimals ) ;
	Plot14( String2 ) ;
	end ;

if PlotTemplate <> 1 then
	Plot4( 0, "ZeroLine" ) ;

if PlotTemplate = 2 then
	begin
	Plot15( MACD( High, FastLength, SlowLength ),
 	 "MACD-H" ) ;
	Plot16( MACD( Close, FastLength, SlowLength ),
	 "MACD-C" ) ;
	Plot17( MACD( Low, FastLength, SlowLength ),
	 "MACD-L" ) ;
	end ;

if PlotTemplate = 3 then
	begin
	MACDBBAvg = Average( MyMACD, BBAvgLen ) ;
	UpperBand = BollingerBand( MyMACD, BBAvgLen,
	 BBStdDev ) ;
	LowerBand = BollingerBand( MyMACD, BBAvgLen,
	 -BBStdDev ) ;

	Plot5( UpperBand, "UpperBand" ) ;
	Plot6( LowerBand, "LowerBand" ) ;
	Plot7( MACDBBAvg, "BB Avg" ) ;
	Plot8( UpperBand, "UBand" ) ; { for cross-hatch }
	Plot9( LowerBand, "LBand" ) ; { for cross-hatch }

	{ Color for Plots 1 & 12 }
	if MyMACD > MyMACD[1] then
		begin
		SetPlotColor[1]( 1, Green ) ;
		SetPlotColor( 12, Green ) ;
		end
	else
		begin
		SetPlotColor[1]( 1, Red ) ;
		SetPlotColor( 12, Red ) ;
		end ;
	end ;

if PlotTemplate = 4 then
	begin
	MyMACD_TF1 = MACD( Price, FastLength *
	 MACD_TF_Mult1, SlowLength * MACD_TF_Mult1 ) ;
	MyMACD_TF2 = MACD( Price, FastLength *
	 MACD_TF_Mult2, SlowLength * MACD_TF_Mult2 ) ;
	Plot10( MyMACD_TF1, "MACD TF1" ) ;
	Plot11( MyMACD_TF2, "MACD TF2" ) ;
	SetPlotColor( 1, Blue ) ;
	SetPlotColor( 12, Blue ) ;
	end ;

if MACDDiff > 0 then
	if MACDDiff > MACDDiff[1] then
		SetPlotColor( 3, Green )
	else
		SetPlotColor( 3, DarkGreen ) ;

if MACDDiff <= 0 then
	if MACDDiff < MACDDiff[1] then
		SetPlotColor( 3, Red )
	else
		SetPlotColor( 3, DarkRed ) ;


_PMACD_Strategy (Strategy)
{ TASC January 2012 }
{ Reversing MACD by Johnny Dough }

inputs:
	MACDPrice( Close ), { price used for PMACDeq }
	P_Fast( 12 ),
	P_Slow( 26 ),
	P_Signal( 9 ), { PMACDeq EMA Signal length }
	p_bbperiod( 10 ), { BB average length }
	p_bbwidth( 1 ) ; { BB # of standard deviation }

variables:
	MyMACD( 0 ),
	UpperBand( 0 ),
	LowerBand( 0 ) ;

MyMACD = MACD( MACDPrice, P_Fast, P_Slow ) ;
UpperBand = BollingerBand( MyMACD, p_bbperiod,
 p_bbwidth ) ;
LowerBand = BollingerBand( MyMACD, p_bbperiod,
 -p_bbwidth ) ;

{ Entry }
if MyMACD crosses above UpperBand then
	Buy ( "MACD BB LE" ) next bar market ;

if MyMACD crosses below LowerBand then
	SellShort ( "MACD BB SE" ) next bar market ;

{ Exits }
if MyMACD crosses below UpperBand then
	Sell ( "MACD BB LX" ) next bar market ;

if MyMACD crosses above LowerBand then
	BuyToCover ( "MACD BB SX" ) next bar market ;


_PMACDeq (Function)

{ TASC January 2012 }
{ Reversing MACD by Johnny Dough }
{ returns price where MACD is equal to previous bar
  MACD }

inputs:
	Price( numericseries ),
	period_X( numericsimple ),
	period_Y( numericsimple ) ;

variables:
	alphaX( 0 ),
	alphaY( 0 ) ;

once
	begin
	alphaX = 2 / ( 1 + period_X ) ;
	alphaY = 2 / ( 1 + period_Y ) ;
	end ;

_PMACDeq = ( XAverage( Price, period_X ) * alphaX -
 XAverage( Price, period_Y ) * alphaY ) /
 ( alphaX - alphaY ) ;


_PMACDlevel (Function)
{ TASC January 2012 }
{ Reversing MACD by Johnny Dough }

inputs:
	level( numericsimple ),
	Price( numericseries ),
	period_X( numericsimple ),
	period_Y( numericsimple ) ;

variables:
	alphaX( 0 ),
	alphaY( 0 ),
	One_alphaX( 0 ),
	One_alphaY( 0 ) ;

once
	begin
	alphaX = 2 / ( 1 + period_X ) ;
	alphaY = 2 / ( 1 + period_Y ) ;
	One_alphaX = 1 - alphaX ;
	One_alphaY = 1 - alphaY ;
	end ;

_PMACDlevel = ( Level + XAverage( Price, period_Y ) *
 One_alphaY - XAverage( Price, period_X )* One_alphaX )
 / ( alphaX - alphaY ) ;


_PMACDzero (Function)

{ TASC January 2012 }
{ Reversing MACD by Johnny Dough }

inputs:
	Price( numericseries ),
	period_X( numericsimple ),
	period_Y( numericsimple ) ;

_PMACDzero = _PMACDlevel( 0, Price, period_X,
 period_Y ) ;
To download the EasyLanguage code for the indicator, first navigate to the EasyLanguage FAQs and Reference Posts Topic in the EasyLanguage Support Forum (https://www.tradestation.com/Discussions/Topic.aspx?Topic_ID=47452), scroll down and click on the link labeled “Traders’ Tips, TASC.” Then select the appropriate link for the month and year. The ELD filename is “_PMACD.ELD.”
A sample chart is shown in Figure 1.
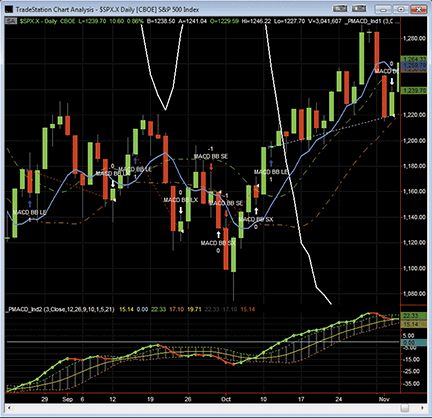
FIGURE 1: TRADESTATION, REVERSING MACD. Here is a daily chart of the S&P 500 index ($SPX.X) along with the two indicators (PlotTemplate is set to “3” in both indicators) and the strategy code. A long entry occurs when the MACD value crosses above the UpperBand and a long exit occurs when the MACD value crosses below the UpperBand. A short entry occurs when the MACD value crosses below the LowerBand and a short exit occurs when the MACD value crosses above the LowerBand.
This article is for informational purposes. No type of trading or investment recommendation, advice, or strategy is being made, given, or in any manner provided by TradeStation Securities or its affiliates.

METASTOCK: REVERSING MACD
Johnny Dough’s article in this issue, “Reversing MACD,” describes how to make all-in-one indicators for use in AmiBroker and how to use them. Here are the steps to implement the same indicators in MetaStock:
- In the Tools menu, select “Indicator Builder.”
- Click New to open the Indicator Editor for a new indicator.
- Type in the name “MACD price window all in one.”
- Click in the larger window and paste or type in the following formula:
t1:= Input("fast periods", 5, 24, 12); t2:= Input("slow periods", 10, 52, 26); pick:= Input("plot: <1=MACDeq 2=MACDeq0 3=HLC 4=BBands>",1,4,1); a1:= 2/(t1+1); a2:= 2/(t2+1); CMACDeq:=(Ref(Mov(C,t1,E)*a1,-1)-Ref(Mov(C,t2,E)*a2,-1))/(a1-a2); HMACDeq:=(Ref(Mov(H,t1,E)*a1,-1)-Ref(Mov(H,t2,E)*a2,-1))/(a1-a2); LMACDeq:=(Ref(Mov(L,t1,E)*a1,-1)-Ref(Mov(L,t2,E)*a2,-1))/(a1-a2); MACDeq0:= Ref(Mov(C,t2,E)*(1-a2) - Mov(C,t1,E)*(1-a1),-1)/(a1-a2); z:= LastValue(If(pick > 2, 0, Cum(1)+1)); plot1:= If(pick=3, HMACDeq, BBandTop(CMACDeq,10,S,1)); plot2:= If(pick=2, MACDeq0, CMACDeq); plot3:= If(pick=3, LMACDeq, BBandBot(CMACDeq,10,S,1)); plot1 + Ref(0,+z); plot2; plot3 + Ref(0,+z); - Click OK to close the Indicator Editor.
- Click New to open the Indicator Editor for the second indicator.
- Type the name “MACD indicator window all in one.”
- Click in the larger window and paste or type in the following formula:
t1:= Input("fast periods", 5, 24, 12); t2:= Input("slow periods", 10, 52, 26); t3:= Input("signal periods", 3, 18, 9); pick:= Input("plot: <1=MACD 2=MACD_HLC 3=MACD_MTF>",1,4,1); MACDH:=Mov(H,t1,E)-Mov(H,t2,E); MACDL:=Mov(L,t1,E)-Mov(L,t2,E); MACDC:=OscP(12,26,E,$); MTFw:=OscP(12*5,26*5,E,$); MTFM:=OscP(12*21,26*21,E,$); y:= LastValue(If(pick <>2, 0, Cum(1)+1)); z:= LastValue(If(pick > 1, 0, Cum(1)+1)); plot1:= MACDC; plot2:= If(pick=2, MACDH, MTFw); plot3:= If(pick=2, MACDL, MTFm); plot4:= Mov(MACDC,t3,E); plot1; plot2 + Ref(0,+z); plot3 + Ref(0,+z); plot4 + Ref(0,+y); - Click OK to close the Indicator Editor.
- Click OK to close the Indicator Builder.

THINKORSWIM.COM: REVERSING MACD
For Traders’ Tips this month, we’ll ring in the new year by diving into the ever-popular MACD and giving you some new tools to integrate into your trading. The denizens of our scripting laboratory have gotten into the spirit of things and whipped up a pair of thinkscript indicators that replicate the functions that Johnny Dough describes in his article in this issue, “Reversing MACD.” (See Figure 2.)
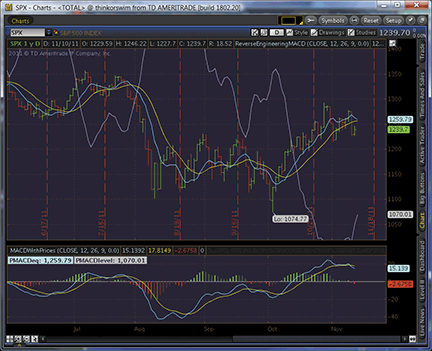
FIGURE 2: THINKORSWIM: REVERSING MACD
The code for each study is shown below along with instructions for application.
- From our TOS Charts, Select Studies → Edit Studies
- Select the “Studies” tab in the upper left-hand corner.
- Select “New” in the lower left-hand corner.
- Name the study (“ReverseEngineeringMACD”)
- Click in the script editor window, remove “plot Data = close;” and paste in the following:
input price = close;
input fastLength = 12;
input slowLength = 26;
input MACDLength = 9;
input MACDLevel = .0;

def fastCoeff = 2 / (1 + fastLength);
def slowCoeff = 2 / (1 + slowLength);
def prevFastEMA = ExpAverage(price, fastLength)[1];
def prevSlowEMA = ExpAverage(price, slowLength)[1];

plot PMACDeq = (prevFastEMA * fastCoeff - prevSlowEMA * slowCoeff) / (fastCoeff - slowCoeff);
plot EMA_PMACDeq = ExpAverage(PMACDeq, MACDLength);
plot PMACDlevel = (MACDLevel - prevFastEMA * (1 - fastCoeff) + prevSlowEMA * (1 - slowCoeff)) / (fastCoeff - slowCoeff);

PMACDeq.SetDefaultColor(GetColor(1));
EMA_PMACDeq.SetDefaultColor(GetColor(8));
PMACDlevel.SetDefaultColor(GetColor(3));
- Select OK.
- Select “New” in the lower left-hand corner to add the second study.
- Name the study (“MACDWithPrices”).
- Click in the script editor window, remove “plot Data = close;” and paste in the following:
declare lower; input price = close; input fastLength = 12; input slowLength = 26; input MACDLength = 9; input MACDLevel = .0; def fastEMA = ExpAverage(price, fastLength); def slowEMA = ExpAverage(price, slowLength); def prevFastEMA = fastEMA[1]; def prevSlowEMA = slowEMA[1]; plot Value = fastEMA - slowEMA; plot Avg = ExpAverage(Value, MACDLength); plot Diff = Value - Avg; plot Level = MACDLevel; def fastCoeff = 2 / (1 + fastLength); def slowCoeff = 2 / (1 + slowLength); def PMACDeq = (prevFastEMA * fastCoeff - prevSlowEMA * slowCoeff) / (fastCoeff - slowCoeff); def PMACDlevel = (MACDLevel - prevFastEMA * (1 - fastCoeff) + prevSlowEMA * (1 - slowCoeff)) / (fastCoeff - slowCoeff); AddChartLabel(yes, concat("PMACDeq: ", round(PMACDeq[-1])), Value.TakeValueColor()); AddChartLabel(yes, concat("PMACDlevel: ", round(PMACDlevel[-1])), Level.TakeValueColor()); Value.SetDefaultColor(GetColor(1)); Avg.SetDefaultColor(GetColor(8)); Diff.DefineColor("Positive and Up", Color.GREEN); Diff.DefineColor("Positive and Down", Color.DARK_GREEN); Diff.DefineColor("Negative and Down", Color.RED); Diff.DefineColor("Negative and Up", Color.DARK_RED); Diff.AssignValueColor(if Diff >= 0 then if Diff > Diff[1] then Diff.color("Positive and Up") else Diff.color("Positive and Down") else if Diff < Diff[1] then Diff.color("Negative and Down") else Diff.color("Negative and Up")); Diff.SetPaintingStrategy(PaintingStrategy.HISTOGRAM); Diff.SetLineWeight(3); Level.SetDefaultColor(GetColor(3)); - Select OK and you’re set to go!

eSIGNAL: REVERSING MACD
For this month’s Traders’ Tip, we’ve provided two formulas, ReversingMACD.efs and ReversingMACD_Indicator.efs, based on Johnny Dough’s article in this issue, “Reversing MACD.”
Both studies contain formula parameters to set the price source, period fast, period slow, period signal, and plot chart values, which may be configured through the Edit Chart window. The reversing MACD indicator contains one additional parameter for the Bollinger Bands period.
To discuss this study or download a complete copy of the formula code, please visit the EFS Library Discussion Board forum under the forums link from the support menu at www.esignal.com or visit our EFS KnowledgeBase at www.esignal.com/support/kb/efs/. The eSignal formula scripts (EFS) are also available for copying and pasting below.
A sample chart is shown in Figure 3.
REVERSINGMACD.EFS

/*********************************
Provided By:
    Interactive Data Corporation (Copyright © 2010)
    All rights reserved. This sample eSignal Formula Script (EFS)
    is for educational purposes only. Interactive Data Corporation
    reserves the right to modify and overwrite this EFS file with
    each new release.

Description:
    Reversing MACD

Version:            1.00  14/11/2011

Formula Parameters:                     Default:
Price Source                            Close
Period Fast                             12
Period Slow                             26
Period Signal                           9
Plot Chart                              PMACD


Notes:
    The related article is copyrighted material. If you are not a subscriber
    of Stocks & Commodities, please visit www.traders.com.

**********************************/

// predefined constants
var BBPERIOD = 10;
var BBSTDEV = 1;

var fpArray = new Array();

function preMain()
{
    setPriceStudy(true);
    setStudyTitle("Reversing MACD");

    var x=0;
    fpArray[x] = new FunctionParameter("priceSource", FunctionParameter.STRING);
    with(fpArray[x++])
    {
	setName("Price Source");
        addOption("Open");
        addOption("Close");
        addOption("Low");
        addOption("High");
        addOption("HL/2");
        addOption("HLC/3");
        addOption("OHLC/4");
        setDefault("Close");
    }

    fpArray[x] = new FunctionParameter("pFast", FunctionParameter.NUMBER);
    with(fpArray[x++])
    {
	setName("Period Fast");
	setLowerLimit(1);
        setUpperLimit(24);
        setDefault(12);
    }

    fpArray[x] = new FunctionParameter("pSlow", FunctionParameter.NUMBER);
    with(fpArray[x++])
    {
	setName("Period Slow");
	setLowerLimit(2);
        setUpperLimit(52);
        setDefault(26);
    }

    fpArray[x] = new FunctionParameter("pSignal", FunctionParameter.NUMBER);
    with(fpArray[x++])
    {
	setName("Period Signal");
	setLowerLimit(0);
        setUpperLimit(18);
        setDefault(9);
    }

    fpArray[x] = new FunctionParameter("pPlotChart", FunctionParameter.STRING);
    with(fpArray[x++])
    {
	setName("Plot Chart");
        addOption("PMACD");
        addOption("PMACD_HLC");
        addOption("PMACD_BB");
        addOption("PMACD_MTF");
        setDefault("PMACD");
    }
}

var bInit = false;
var bVersion = null;

var xSource = null;
var xPMACD_0 = null;

function main(priceSource, pFast, pSlow, pSignal, pPlotChart)
{
    if (bVersion == null) bVersion = verify();
    if (bVersion == false) return;

    if(!bInit)
    {
        switch (priceSource)
        {
                case 'Open':
                   xSource = open();
                   break;
                case 'Close':
                   xSource = close();
                   break;
                case 'High':
                   xSource = high();
                   break;
                case 'Low':
                   xSource = low();
                   break;
                case 'HL/2':
                   xSource = hl2();
                   break;
                case 'HLC/3':
                   xSource = hlc3();
                   break;
                case 'OHLC/4':
                   xSource = ohlc4();
                   break;
                default : return;
        }

        xPMACD_0 = efsInternal("PMACDzero", pFast, pSlow, xSource);

        setCursorLabelName("PMACDzero", 0);
        setDefaultBarThickness(3, 0);
    }

    var resultArr = null;

    switch (pPlotChart)
    {
        case "PMACD" :
            resultArr = calc_PMACD(xSource, pFast, pSlow, pSignal);
            break;

        case "PMACD_HLC" :
            resultArr = calc_PMACD_HLC(pFast, pSlow);
            break;

        case "PMACD_BB" :
            resultArr = calc_PMACD_BB(xSource, pFast, pSlow);
            break;

        case "PMACD_MTF" :
            resultArr = calc_PMACD_MTF(xSource, pFast, pSlow);
            break;

        default :
            bInit = true;
            return;
    }

    var nPMACD_0 = xPMACD_0.getValue(0);
    var nSource = xSource.getValue(0);

    // PMACD_0 vs price selected
    if(nPMACD_0 < nSource)
        setDefaultBarFgColor(Color.darkgreen, 0);
    else
        setDefaultBarFgColor(Color.maroon, 0);

    resultArr.unshift(nPMACD_0);

    return resultArr;
}

// calc_PMACD

var xPMACD = null;
var xEMA = null;

function calc_PMACD(xSource, pFast, pSlow, pSignal)
{
    if(!bInit)
    {
        xPMACD = efsInternal("PMACDeq", pFast, pSlow, xSource);
        xEMA = ema(pSignal, xPMACD);

        setCursorLabelName("PMACDeq", 1);
        setCursorLabelName("EMA(PMACDeq)", 2);

        setDefaultBarThickness(2, 1);
        setDefaultBarThickness(1, 2);

        setDefaultBarFgColor(Color.RGB(0, 100, 255) , 1);
        setDefaultBarFgColor(Color.RGB(255, 100, 0), 2);

        bInit = true;
    }

    var nPMACD = xPMACD.getValue(0);
    var nEMA = xEMA.getValue(0);

    return new Array(nPMACD, nEMA);
}

// calc_PMACD_HLC

var xPMACD_H = null;
var xPMACD_C = null;
var xPMACD_L = null;

function calc_PMACD_HLC(pFast, pSlow)
{
    if(!bInit)
    {
        xPMACD_H = efsInternal("PMACDeq", pFast, pSlow, high());
        xPMACD_C = efsInternal("PMACDeq", pFast, pSlow, close());
        xPMACD_L = efsInternal("PMACDeq", pFast, pSlow, low());

        setCursorLabelName("PMACDeq(High)", 1);
        setCursorLabelName("PMACDeq(Close)", 2);
        setCursorLabelName("PMACDeq(Low)", 3);

        setDefaultBarThickness(1, 1);
        setDefaultBarThickness(2, 2);
        setDefaultBarThickness(1, 3);

        setDefaultBarFgColor(Color.lime, 1);
        setDefaultBarFgColor(Color.RGB(0, 100, 255), 2);
        setDefaultBarFgColor(Color.RGB(255, 100, 0), 3);

        bInit = true;
    }

    var nPMACD_H = xPMACD_H.getValue(0);
    var nPMACD_C = xPMACD_C.getValue(0);
    var nPMACD_L = xPMACD_L.getValue(0);

    return new Array(nPMACD_H, nPMACD_C, nPMACD_L);
}

// calc_PMACD_BB

var xPMACD_BB = null;
var xPMACD_bTop = null;
var xPMACD_bBot = null;

function calc_PMACD_BB(xSource, pFast, pSlow)
{
    if(!bInit)
    {
        xPMACD_BB = efsInternal("PMACDeq", pFast, pSlow, xSource);
        xPMACD_bTop = upperBB(BBPERIOD, BBSTDEV, xPMACD_BB);
        xPMACD_bBot = lowerBB(BBPERIOD, BBSTDEV, xPMACD_BB);

        setCursorLabelName("PMACDeq", 1);
        setCursorLabelName("BBTop", 2);
        setCursorLabelName("BBBot", 3);

        setDefaultBarThickness(2, 1);
        setDefaultBarThickness(1, 2);
        setDefaultBarThickness(1, 3);

        setDefaultBarFgColor(Color.RGB(0, 100, 255), 1);
        setDefaultBarFgColor(Color.lime, 2);
        setDefaultBarFgColor(Color.RGB(255, 100, 0), 3);

        bInit = true;
    }

    var nPMACD_BB = xPMACD_BB.getValue(0);
    var nPMACD_bTop = xPMACD_bTop.getValue(0);
    var nPMACD_bBot = xPMACD_bBot.getValue(0);

    return new Array(nPMACD_BB, nPMACD_bTop, nPMACD_bBot);
}

// calc_PMACD_MTF

var xPMACD_MTF = null;
var xPMACD_MTF5 = null;
var xPMACD_MTF21 = null;

function calc_PMACD_MTF(xSource, pFast, pSlow)
{
    if(!bInit)
    {
        xPMACD_MTF = efsInternal("PMACDeq", pFast, pSlow, xSource);
        xPMACD_MTF5 = efsInternal("PMACDeq", 5 * pFast, 5 * pSlow, xSource);
        xPMACD_MTF21 = efsInternal("PMACDeq", 21 * pFast, 21 * pSlow, xSource);

        setCursorLabelName("PMACDeq", 1);
        setCursorLabelName("5*PMACDeq", 2);
        setCursorLabelName("21*PMACDeq", 3);

        setDefaultBarThickness(2, 1);
        setDefaultBarThickness(1, 2);
        setDefaultBarThickness(1, 3);

        setDefaultBarFgColor(Color.RGB(0, 100, 255), 1);
        setDefaultBarFgColor(Color.lime, 2);
        setDefaultBarFgColor(Color.RGB(255, 100, 0), 3);

        bInit = true;
    }

    var nPMACD_MTF = xPMACD_MTF.getValue(0);
    var nPMACD_MTF5 = xPMACD_MTF5.getValue(0);
    var nPMACD_MTF21 = xPMACD_MTF21.getValue(0);

    return new Array(nPMACD_MTF, nPMACD_MTF5, nPMACD_MTF21);
}


/*************************************************
             SUPPORT FUNCTIONS
**************************************************/

// PMACDeq - calculates what the next bar price needs to be for the MACD value to be the same.

var alphaX_eq = null;
var alphaY_eq = null;
var xEMAx_eq = null;
var xEMAy_eq = null;

var PMACDeq_Init = false;

function PMACDeq(periodX, periodY, xSeries)
{
    if(!PMACDeq_Init)
    {
        alphaX_eq = 2 / (1 + periodX);
        alphaY_eq = 2 / (1 + periodY);
        xEMAx_eq = ema(periodX, xSeries);
        xEMAy_eq = ema(periodY, xSeries);

        PMACDeq_Init = true;
    }

    var nEMAx = xEMAx_eq.getValue(-1);
    var nEMAy = xEMAy_eq.getValue(-1);

    if (nEMAx == null || nEMAy == null)
        return;

    var result = (alphaX_eq * nEMAx - alphaY_eq * nEMAy) / (alphaX_eq - alphaY_eq);

    return result;
}

// PMACDLevel - calculates what the price needs to be for the MACD value to be particular constant value.

var alphaX_lev = null;
var alphaY_lev = null;
var xEMAx_lev = null;
var xEMAy_lev = null;

var PMACDLevel_Init = false;

function PMACDLevel(periodX, periodY, level, xSeries)
{
    if(!PMACDLevel_Init)
    {
        alphaX_lev = 2 / (1 + periodX);
        alphaY_lev = 2 / (1 + periodY);
        xEMAx_lev = ema(periodX, xSeries);
        xEMAy_lev = ema(periodY, xSeries);

        PMACDLevel_Init = true;
    }

    var nEMAx = xEMAx_lev.getValue(-1);
    var nEMAy = xEMAy_lev.getValue(-1);

    if (nEMAx == null || nEMAy == null)
        return;

    var result = (level + (1 - alphaY_lev) * nEMAy - (1 - alphaX_lev) * nEMAx) / (alphaX_lev - alphaY_lev);

    return result;
}

// PMACDzero

function PMACDzero(periodX, periodY, xSeries)
{
    return PMACDLevel(periodX, periodY, 0, xSeries);
}

// verify version
function verify() {
    var b = false;
    if (getBuildNumber() < 779) {
        drawTextAbsolute(5, 35, "This study requires version 8.0 or later.",
            Color.white, Color.blue, Text.RELATIVETOBOTTOM|Text.RELATIVETOLEFT|Text.BOLD|Text.LEFT,
            null, 13, "error");
        drawTextAbsolute(5, 20, "Click HERE to upgrade.@URL=https://www.esignal.com/download/default.asp",
            Color.white, Color.blue, Text.RELATIVETOBOTTOM|Text.RELATIVETOLEFT|Text.BOLD|Text.LEFT,
            null, 13, "upgrade");
        return b;
    } else {
        b = true;
    }
    return b;
}
REVERSINGMACD_INDICATOR.EFS


/*********************************
Provided By:
    Interactive Data Corporation (Copyright © 2010)
    All rights reserved. This sample eSignal Formula Script (EFS)
    is for educational purposes only. Interactive Data Corporation
    reserves the right to modify and overwrite this EFS file with
    each new release.

Description:
    Reversing MACD Indicator

Version:            1.00  14/11/2011

Formula Parameters:                     Default:
Price Source                            Close
Period Fast                             12
Period Slow                             26
Period Signal                           9
Plot Chart                              PMACD
Bollinger Bands Period                  10


Notes:
    The related article is copyrighted material. If you are not a subscriber
    of Stocks & Commodities, please visit www.traders.com.

**********************************/

// predefined constants
var BBSTDEV = 1;

var fpArray = new Array();

function preMain()
{
    setPriceStudy(false);
    setStudyTitle("Reversing MACD Indicator");

    var x=0;
    fpArray[x] = new FunctionParameter("priceSource", FunctionParameter.STRING);
    with(fpArray[x++])
    {
	setName("Price Source");
        addOption("Open");
        addOption("Close");
        addOption("Low");
        addOption("High");
        addOption("HL/2");
        addOption("HLC/3");
        addOption("OHLC/4");
        setDefault("Close");
    }

    fpArray[x] = new FunctionParameter("pFast", FunctionParameter.NUMBER);
    with(fpArray[x++])
    {
	setName("Period Fast");
	setLowerLimit(1);
        setUpperLimit(24);
        setDefault(12);
    }

    fpArray[x] = new FunctionParameter("pSlow", FunctionParameter.NUMBER);
    with(fpArray[x++])
    {
	setName("Period Slow");
	setLowerLimit(2);
        setUpperLimit(52);
        setDefault(26);
    }

    fpArray[x] = new FunctionParameter("pSignal", FunctionParameter.NUMBER);
    with(fpArray[x++])
    {
	setName("Period Signal");
	setLowerLimit(1);
        setUpperLimit(18);
        setDefault(9);
    }

    fpArray[x] = new FunctionParameter("pPlotIndicator", FunctionParameter.STRING);
    with(fpArray[x++])
    {
	setName("Plot Indicator");
        addOption("MACD");
        addOption("MACD_HLC");
        addOption("MACD_BB");
        addOption("MACD_MTF");
        setDefault("MACD");
    }

    fpArray[x] = new FunctionParameter("pBBPeriod", FunctionParameter.NUMBER);
    with(fpArray[x++])
    {
	setName("Bollinger Bands Period");
	setLowerLimit(2);
        setUpperLimit(20);
        setDefault(10);
    }
}

var bInit = false;
var bVersion = null;

var xSource = null;

var xMACD_0 = null;
var xMACDeq = null;

function main(priceSource, pFast, pSlow, pSignal, pPlotIndicator, pBBPeriod)
{
    if (bVersion == null) bVersion = verify();
    if (bVersion == false) return;

    if(!bInit)
    {
        switch (priceSource)
        {
                case 'Open':
                   xSource = open();
                   break;
                case 'Close':
                   xSource = close();
                   break;
                case 'High':
                   xSource = high();
                   break;
                case 'Low':
                   xSource = low();
                   break;
                case 'HL/2':
                   xSource = hl2();
                   break;
                case 'HLC/3':
                   xSource = hlc3();
                   break;
                case 'OHLC/4':
                   xSource = ohlc4();
                   break;
                default : return;
        }
    }

    var resultArr = null;

    switch (pPlotIndicator)
    {
        case "MACD" :
            resultArr = calc_MACD(xSource, pFast, pSlow, pSignal);
            break;

        case "MACD_HLC" :
            resultArr = calc_MACD_HLC(pFast, pSlow);
            break;

        case "MACD_BB" :
            resultArr = calc_MACD_BB(xSource, pFast, pSlow, pSignal, pBBPeriod);
            break;

        case "MACD_MTF" :
            resultArr = calc_MACD_MTF(xSource, pFast, pSlow, pSignal);
            break;

        default :
            bInit = true;
            return;
    }

    return resultArr;
}

// calc_MACD

var xMACD = null;
var xEMA = null;

function calc_MACD(xSource, pFast, pSlow, pSignal)
{
    if(!bInit)
    {
        xMACD = macd(pFast, pSlow, 1, xSource);
        xEMA = ema(pSignal, xMACD);

        xMACDeq = efsInternal("PMACDeq", pFast, pSlow, xSource);
        xMACD_0 = efsInternal("PMACDzero", pFast, pSlow, xSource);

        setCursorLabelName("MACD", 0);
        setCursorLabelName("Signal", 1);
        setCursorLabelName("MACD Histogram", 2);
        setCursorLabelName("PMACDeq", 3);
        setCursorLabelName("PMACDzero", 4);

        setDefaultBarThickness(2, 0);
        setDefaultBarThickness(1, 1);
        setDefaultBarThickness(1, 2);
        setDefaultBarThickness(1, 3);
        setDefaultBarThickness(1, 4);

        setShowCursorLabel(false, 2);
        setPlotType(PLOTTYPE_HISTOGRAM, 2);

        setShowSeries(false, 3);
        setShowSeries(false, 4);

        setDefaultBarFgColor(Color.RGB(0, 100, 255) , 0);
        setDefaultBarFgColor(Color.RGB(255, 100, 0), 1);
        setDefaultBarFgColor(Color.purple, 2);
        setDefaultBarFgColor(Color.aqua, 3);
        setDefaultBarFgColor(Color.yellow, 4);

        bInit = true;
    }

    var nMACD = xMACD.getValue(0);
    var nEMA = xEMA.getValue(0);

    if(nEMA == null)
        return;

    var nMACDeq = xMACDeq.getValue(0);
    var nMACD_0 = xMACD_0.getValue(0);

    return new Array(nMACD, nEMA, nMACD - nEMA, nMACDeq, nMACD_0);
}

// calc_MACD_HLC

var xMACD_H = null;
var xMACD_C = null;
var xMACD_L = null;

function calc_MACD_HLC(pFast, pSlow)
{
    if(!bInit)
    {
        xMACD_H = macd(pFast, pSlow, 1, high());
        xMACD_C = macd(pFast, pSlow, 1, close());
        xMACD_L = macd(pFast, pSlow, 1, low());

        setCursorLabelName("MACD(High)", 0);
        setCursorLabelName("MACD(Close)", 1);
        setCursorLabelName("MACD(Low)", 2);
        setCursorLabelName("zero level", 3);

        setShowCursorLabel(false, 3);

        setDefaultBarThickness(1, 0);
        setDefaultBarThickness(2, 1);
        setDefaultBarThickness(1, 2);
        setDefaultBarThickness(1, 3);

        setDefaultBarFgColor(Color.lime, 0);
        setDefaultBarFgColor(Color.RGB(0, 100, 255), 1);
        setDefaultBarFgColor(Color.RGB(255, 100, 0), 2);
        setDefaultBarFgColor(Color.grey, 3);

        bInit = true;
    }

    var nMACD_H = xMACD_H.getValue(0);
    var nMACD_C = xMACD_C.getValue(0);
    var nMACD_L = xMACD_L.getValue(0);

    if(nMACD_H == null || nMACD_C == null || nMACD_L == null)
        return;

    return new Array(nMACD_H, nMACD_C, nMACD_L, 0);
}

// calc_MACD_BB

var xMACD_BB = null;
var xEMA_BB = null;
var xMACD_bTop = null;
var xMACD_bBot = null;


function calc_MACD_BB(xSource, pFast, pSlow, pSignal, pBBPeriod)
{
    if(!bInit)
    {
        xMACD_BB = macd(pFast, pSlow, 1, xSource);
        xEMA_BB = ema(pSignal, xMACD_BB);
        xMACD_bTop = upperBB(pBBPeriod, BBSTDEV, xMACD_BB);
        xMACD_bBot = lowerBB(pBBPeriod, BBSTDEV, xMACD_BB);


        setCursorLabelName("MACD", 0);
        setCursorLabelName("MACD Histogram", 1);
        setCursorLabelName("BBTop", 2);
        setCursorLabelName("BBBot", 3);
        setCursorLabelName("(BBTop + BBBot)/2", 4);

        setDefaultBarThickness(2, 0);
        setDefaultBarThickness(1, 1);
        setDefaultBarThickness(1, 2);
        setDefaultBarThickness(1, 3);
        setDefaultBarThickness(1, 4);

        setShowCursorLabel(false, 1);
        setShowCursorLabel(false, 4);

        setPlotType(PLOTTYPE_HISTOGRAM, 1);

        setDefaultBarFgColor(Color.darkgreen, 2);
        setDefaultBarFgColor(Color.maroon, 3);
        setDefaultBarFgColor(Color.grey, 4);

        bInit = true;
    }

    var nMACD_BB = xMACD_BB.getValue(0);
    var nnMACD_BB = xMACD_BB.getValue(-1);

    if(nMACD_BB < 0 && nMACD_BB > nnMACD_BB)
        setDefaultBarFgColor(Color.RGB(200, 255, 0), 0);
    else
        if (nMACD_BB > 0 && nMACD_BB > nnMACD_BB)
            setDefaultBarFgColor(Color.RGB(70, 255, 0), 0);
        else
            if (nMACD_BB > 0 && nMACD_BB < nnMACD_BB)
                setDefaultBarFgColor(Color.RGB(255, 100, 0), 0);
            else
                setDefaultBarFgColor(Color.red, 0);

    var nEMA_BB = xEMA_BB.getValue(0);
    var nHist = nMACD_BB - nEMA_BB;

    if(nHist > 0)
        setDefaultBarFgColor(Color.purple, 1);
    else
        setDefaultBarFgColor(Color.RGB(0, 100, 255), 1);


    var nMACD_bTop = xMACD_bTop.getValue(0);
    var nMACD_bBot = xMACD_bBot.getValue(0);

    if (nEMA_BB == null || nMACD_bTop == null || nMACD_bBot == null)
        return;

    return new Array(nMACD_BB, nHist, nMACD_bTop, nMACD_bBot, (nMACD_bTop + nMACD_bBot) / 2);
}

// calc_MACD_MTF

var xMACD_MTF = null;
var xMACD_MTF5 = null;
var xMACD_MTF21 = null;

function calc_MACD_MTF(xSource, pFast, pSlow, pSignal)
{
    if(!bInit)
    {
        xMACD_MTF = macd(pFast, pSlow, xSource);
        xMACD_MTF5 = macd(5 * pFast, 5 * pSlow, xSource);
        xMACD_MTF21 = macd(21 * pFast, 21 * pSlow, xSource);

        xMACDeq = efsInternal("PMACDeq", pFast, pSlow, xSource);
        xMACD_0 = efsInternal("PMACDzero", pFast, pSlow, xSource);

        setCursorLabelName("MACD", 0);
        setCursorLabelName("5*MACD", 1);
        setCursorLabelName("21*MACD", 2);
        setCursorLabelName("PMACDeq", 3);
        setCursorLabelName("PMACDzero", 4);
        setCursorLabelName("zero level", 5);

        setDefaultBarThickness(2, 0);
        setDefaultBarThickness(1, 1);
        setDefaultBarThickness(1, 2);
        setDefaultBarThickness(1, 3);
        setDefaultBarThickness(1, 4);
        setDefaultBarThickness(1, 5);

        setShowSeries(false, 3);
        setShowSeries(false, 4);
        setShowCursorLabel(false, 5);

        setDefaultBarFgColor(Color.RGB(0, 100, 255), 0);
        setDefaultBarFgColor(Color.lime, 1);
        setDefaultBarFgColor(Color.RGB(255, 100, 0), 2);
        setDefaultBarFgColor(Color.aqua, 3);
        setDefaultBarFgColor(Color.yellow, 4);
        setDefaultBarFgColor(Color.grey, 5);

        bInit = true;
    }

    var nMACD_MTF = xMACD_MTF.getValue(0);
    var nMACD_MTF5 = xMACD_MTF5.getValue(0);
    var nMACD_MTF21 = xMACD_MTF21.getValue(0);

    if(nMACD_MTF == null)
        return;

    var nMACDeq = xMACDeq.getValue(0);
    var nMACD_0 = xMACD_0.getValue(0);

    return new Array(nMACD_MTF, nMACD_MTF5, nMACD_MTF21, nMACDeq, nMACD_0, 0);
}


/*************************************************
             SUPPORT FUNCTIONS
**************************************************/

// PMACDeq - calculates what the next bar price needs to be for the MACD value to be the same.

var alphaX_eq = null;
var alphaY_eq = null;
var xEMAx_eq = null;
var xEMAy_eq = null;

var PMACDeq_Init = false;

function PMACDeq(periodX, periodY, xSeries)
{
    if(!PMACDeq_Init)
    {
        alphaX_eq = 2 / (1 + periodX);
        alphaY_eq = 2 / (1 + periodY);
        xEMAx_eq = ema(periodX, xSeries);
        xEMAy_eq = ema(periodY, xSeries);

        PMACDeq_Init = true;
    }

    var nEMAx = xEMAx_eq.getValue(-1);
    var nEMAy = xEMAy_eq.getValue(-1);

    if (nEMAx == null || nEMAy == null)
        return;

    var result = (alphaX_eq * nEMAx - alphaY_eq * nEMAy) / (alphaX_eq - alphaY_eq);

    return result;
}

// PMACDLevel - calculates what the price needs to be for the MACD value to be particular constant value.

var alphaX_lev = null;
var alphaY_lev = null;
var xEMAx_lev = null;
var xEMAy_lev = null;

var PMACDLevel_Init = false;

function PMACDLevel(periodX, periodY, level, xSeries)
{
    if(!PMACDLevel_Init)
    {
        alphaX_lev = 2 / (1 + periodX);
        alphaY_lev = 2 / (1 + periodY);
        xEMAx_lev = ema(periodX, xSeries);
        xEMAy_lev = ema(periodY, xSeries);

        PMACDLevel_Init = true;
    }

    var nEMAx = xEMAx_lev.getValue(-1);
    var nEMAy = xEMAy_lev.getValue(-1);

    if (nEMAx == null || nEMAy == null)
        return;

    var result = (level + (1 - alphaY_lev) * nEMAy - (1 - alphaX_lev) * nEMAx) / (alphaX_lev - alphaY_lev);

    return result;
}

// PMACDzero

function PMACDzero(periodX, periodY, xSeries)
{
    return PMACDLevel(periodX, periodY, 0, xSeries);
}

// verify version
function verify() {
    var b = false;
    if (getBuildNumber() < 779) {
        drawTextAbsolute(5, 35, "This study requires version 8.0 or later.",
            Color.white, Color.blue, Text.RELATIVETOBOTTOM|Text.RELATIVETOLEFT|Text.BOLD|Text.LEFT,
            null, 13, "error");
        drawTextAbsolute(5, 20, "Click HERE to upgrade.@URL=https://www.esignal.com/download/default.asp",
            Color.white, Color.blue, Text.RELATIVETOBOTTOM|Text.RELATIVETOLEFT|Text.BOLD|Text.LEFT,
            null, 13, "upgrade");
        return b;
    } else {
        b = true;
    }
    return b;
}
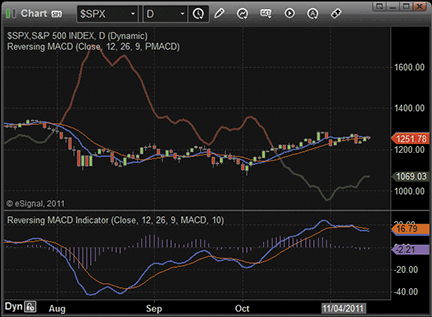
FIGURE 3: ESIGNAL: REVERSING MACD

WEALTH-LAB: REVERSING MACD
Wouldn’t it be cool to anticipate the price when MACD crosses above or below zero and act on that — one bar ahead? The strategy code presented here, which is based on Johnny Dough’s article in this issue, “Reversing MACD,” allows Wealth-Lab users to backtest the concept.
The idea is to buy at stop at the reverse-engineered price when the MACD is crossing zero from below and to exit if the opposite criteria have been met. Although we’re putting long trades in focus, it’s equally easy to apply the idea to the short side as well; simply reverse the rules.
We’ve saved you from the trouble of recreating the reversed MACD DataSeries in Wealth-Lab by including it in the TASCIndicators library. Before you can start charting the data series or utilizing it in your strategies — be they coded in C# or built with the help of the GUI-based strategy wizard — please install the “TASC Magazine Indicators” library from the extensions section of www.wealth-lab.com if you haven’t done so, or apply the update directly using Wealth-Lab’s Extension Manager. In both cases, don’t forget to restart Wealth-Lab.
Copy/paste the included strategy’s C# code or simply let Wealth-Lab do the job: In the “open strategy” dialog, click “download” to get this strategy’s code, as well as many other strategies contributed by the Wealth-Lab community.
A sample chart is shown in Figure 4.
C# code:

using System;
using System.Drawing;
using WealthLab;
using WealthLab.Indicators;
using TASCIndicators;

namespace WealthLab.Strategies
{
	public class ReversingMACD : WealthScript
	{
		protected override void Execute()
		{
			DataSeries macd = MACD.Series( Close );
			ChartPane MACDPane = CreatePane( 30, true, true );
			PlotSeries( MACDPane, macd, Color.Red, LineStyle.Solid, 1 );
			DrawHorzLine( MACDPane, 0, Color.Blue, LineStyle.Dashed, 1 );

			// Reversing MACD
			RevEngMACD r = RevEngMACD.Series( Close,12,26 );
			PlotSeries( PricePane, r, Color.Blue, LineStyle.Dashed, 2 );

			for(int bar = r.FirstValidValue; bar < Bars.Count; bar++)
			{
				if (IsLastPositionActive)
				{
					if( macd[bar] > 0 )
						SellAtStop( bar+1, LastPosition, r[bar] );
				}
				else
				{
					if( macd[bar] < 0 )
						BuyAtStop( bar+1, r[bar] );
				}
			}
		}
	}
}
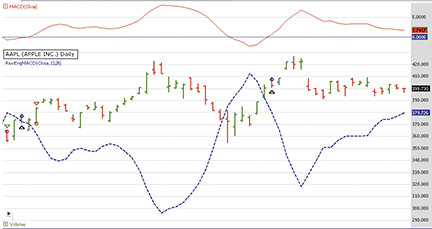
FIGURE 4: WEALTH-LAB, REVERSING MACD. Here is a Wealth-Lab Developer 6.2 chart showing the price equivalent to the reversed MACD crossing the zero line using daily data of AAPL (Apple Inc.). The bluish line showing the reversed MACD is constructed using its traditional settings (close price, periods: 12 and 26).

NEUROSHELL TRADER: REVERSING MACD
The indicators presented by Johnny Dough in his article in this issue, “Reversing MACD,” can be recreated using a few of NeuroShell Trader’s 800+ indicators. Simply select “New Indicator” from the Insert menu and use the Indicator Wizard to set up the following indicators:
PMACDeq ( Price, PeriodX, PeriodY )
Divide ( Subtract( Multiply2( ExpAvg( Price, PeriodX ), Divide(2,Add2(1,PeriodX)) ), Multiply2( ExpAvg( Price, PeriodY ), Divide(2,Add2(1,PeriodY)) ) ) ), Subtract (Divide(2,Add2(1,PeriodX)), Divide(2,Add2(1,PeriodY)) ) )

PMACDlevel ( Level, Price, PeriodX, PeriodY )
Add2( Level, Divide ( Subtract( Multiply2( ExpAvg( Price, PeriodY ), Subtract(1,Divide(2,Add2(1,PeriodY))) ), Multiply2( ExpAvg( Price, PeriodX ), Subtract(1,Divide(2,Add2(1,PeriodX))) ) ) ), Subtract (Divide(2,Add2(1,PeriodX)), Divide(2,Add2(1,PeriodY)) ) ) )

PMACDzero ( Price, PeriodX, PeriodY )
PMACDlevel ( 0, Price, PeriodX, PeriodY )
As Dough suggests in his article, to shift the computed price forward on the chart, simply apply the Lag(X, 1) to any of the above indicators. However, when using these indicators as an input to a prediction or trading strategy, a lag should not be applied to avoid prediction and trading signals lagging by one bar and not using the most recent price calculations.
Users of NeuroShell Trader can go to the Stocks & Commodities section of the NeuroShell Trader free technical support website to download a copy of this or any past Traders’ Tips.
A sample chart is shown in Figure 5.
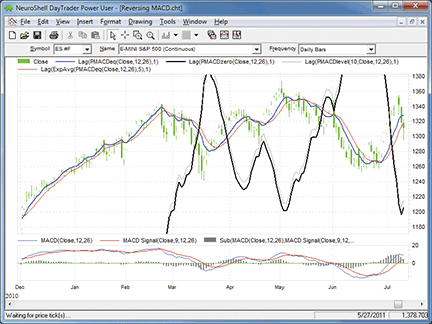
FIGURE 5: NEUROSHELL TRADER, REVERSING MACD. This sample NeuroShell Trader chart shows the reverse MACD price levels.

AIQ: REVERSING MACD
The AIQ code for the reverse MACD functions and indicators described in Johnny Dough’s article in this issue, “Reversing MACD,” is provided at the following website: www.TradersEdgeSystems.com/traderstips.htm, and is also shown below.
In Figure 6, I show a chart of Green Mountain Coffee Inc. with the two PMAC indicators and the MACD indicators. The cyan line is the PMACzero, which is the price tomorrow that would have to be attained for the MACD to equal zero. This indicator has wide swings because sometimes a big move in price is needed to bring the MACD back to zero. The purple line shows the PMACeq indicator, which shows tomorrow’s price that would make MACD the same as it was today. It stays close to the current price. The lower panel shows the MACD (white) and the MACD signal (yellow) indicators.
!REVERSING MACD
!Author: Johnny Dough, TASC January 2012
!Coded by: Richard Denning 11/9/2011
!www.TradersEdgeSystems.com

!ABBREVIATIONS:
C 	is [close].
H	is [high].
L	is [low].
O	is [open].

!INPUTS:
mfast	is 12.
mslow	is 26.
msig	is 9.

!UDFs:
emaFast is expavg(C,mfast).
emaSlow is expavg(C,mslow).
MACD	is emaFast - emaSlow.
sigMACD is expavg(MACD,msig).
len_X	is mfast.
len_Y	is mslow.
lvl	is sigMACD.
alphaX 	is 2 / (1 + len_X).
alphaY 	is 2 / (1 + len_Y).

!PLOT THE FOLLOWING AS SINGLE LINE INDICATOR ON PRICE CHART:
PMACDeq is (expavg(C,len_X)*alphaX
   -expavg(C,len_Y)*alphaY)/(alphaX-alphaY).

one_alphaX is 1 - alphaX.
one_alphaY is 1 - alphaY.
PMACDlvl is (lvl+expavg(C,len_Y)*one_alphaY
   - expavg(C,len_X)*one_alphaX)/(alphaX-alphaY).

!PLOT THE FOLLOWING AS SINGLE LINE INDICATOR ON UPPER CHART:
PMACDzero is (0+expavg(C,len_Y)*one_alphaY
   - expavg(C,len_X)*one_alphaX)/(alphaX-alphaY).
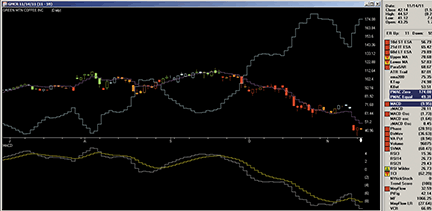
FIGURE 6: AIQ SYSTEMS, REVERSING MACD. Here is an example of the PMACzero (cyan) and PMACeq (purple) indicators on a chart of Green Mountain Coffee Inc. with MACD (white) and MACD signal line (yellow) indicators (lower panel).

TRADERSSTUDIO: REVERSING MACD
The TradersStudio code for Johnny Dough’s reverse MACD functions and indicators from his article in this issue, “Reversing MACD,” is provided at www.TradersEdgeSystems.com/traderstips.htm, and is shown below. The download includes the following code files:
- Function: “PMACeq” computes the price for tomorrow that will make the MACD tomorrow equal to the value it had today
- Function: “PMAClevel” computes the price for tomorrow that will make the MACD equal to the level that is input
- Indicator Plot: “PMAC_Ind” for displaying the two PMAC indicators, PMACeq and PMACzero on a chart.
In Figure 7, I show a chart of Apple Inc. with the two PMAC indicators and the MACD indicators. The white line is the PMACzero, which is the price tomorrow that would have to be attained for the MACD to equal zero.
This indicator has wide swings because sometimes a big move in price is needed to bring the MACD back to zero. The yellow line shows the PMACeq indicator, which shows tomorrow’s price that would make MACD the same as it was today. It stays close to the current price. The lower panel shows the MACD (light green) and the MACD signal (dark green) indicators.
'REVERSING MACD
'Author: Johnny Dough, TASC January 2012
'Coded by: Richard Denning 11/9/2011
'www.TradersEdgeSystems.com

Function PMACeq(price As BarArray,lenX,lenY)
    Dim alphaX As BarArray
    Dim alphaY As BarArray
    Dim Xavg As BarArray
    Dim Yavg As BarArray
    Dim equalMACD As BarArray
    alphaX = 2 / (1 + lenX)
    alphaY = 2 / (1 + lenY)
    Xavg = XAverage(price,lenX)
    Yavg = XAverage(price,lenY)
    If (alphaX-alphaY) <> 0 Then
        equalMACD = (Xavg*alphaX-Yavg*alphaY)/(alphaX-alphaY)
    End If
    PMACeq = equalMACD
End Function
'------------------------------------------------------------
Function PMAClevel(price As BarArray,level,lenX,lenY)
    Dim alphaX As BarArray
    Dim alphaY As BarArray
    Dim one_alphaX As BarArray
    Dim one_alphaY As BarArray
    Dim Xavg As BarArray
    Dim Yavg As BarArray
    Dim levelMACD As BarArray
    alphaX = 2 / (1 + lenX)
    alphaY = 2 / (1 + lenY)
    one_alphaX = 1 - alphaX
    one_alphaY = 1 - alphaY
    Xavg = XAverage(price,lenX)
    Yavg = XAverage(price,lenY)
    If (alphaX-alphaY) <> 0 Then
        levelMACD = (level+Yavg*one_alphaY-Xavg*one_alphaX)/(alphaX-alphaY)
    End If
    PMAClevel = levelMACD
End Function
'--------------------------------------------------------------------------
Sub PMAC_Ind(lenX,lenY)
    Dim PMACzero As BarArray
    Dim PMACval As BarArray

    PMACzero = PMAClevel(C,0,lenX,lenY)
    PMACval = PMACeq(C,lenX,lenY)
    plot1(PMACzero)
    plot2(PMACval)
End Sub
'--------------------------------------
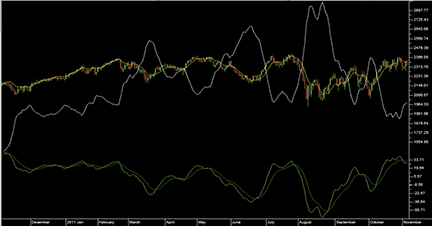
FIGURE 7: TRADERSSTUDIO, REVERSE MACD. Here’s a sample chart of the PMACzero (white) and PMACeq (yellow) indicators on a chart of Apple Inc. with MACD (light green) and MACD signal line (dark green) indicators in the lower panel.

TRADINGSOLUTIONS: REVERSING MACD
In “Reversing MACD” in this issue, author Johnny Dough presents a method for analyzing prices relative to future MACD thresholds.
These functions are described below and are also available as a function file that can be downloaded from the TradingSolutions website (www.tradingsolutions.com) in the Free Systems section.
Note: The “price where” functions are designed to be displayed shifted one bar forward in charts. To do this in TradingSolutions, right-click on the field in the chart, select “Change display properties of field,” and set the “Bars to shift display of this field forward” to “1” on the Value tab.
Function Name: General MACD Function
Short Name: MACDa
Inputs: Price, Fast Period, Slow Period

Sub (EMA (Price, Fast Period), EMA (Price, Slow Period))

Function Name: Price Where MACD Is Equal To Prev MACD
Short Name: PMACDeq
Inputs: Price, Fast Period, Slow Period

Div (Sub (Mult (EMA (Price, Fast Period), Div (2, Add (1, Fast Period))), Mult (EMA (Price, Slow Period), Div (2, Add (1, Slow Period)))), Sub (Div (2, Add (1, Fast Period)), Div (2, Add (1, Slow Period))))

Function Name: Price Where MACD Is Equal To Value
Short Name: PMACDlevel
Inputs: Level, Price, Fast Period, Slow Period

Div (Add (Level, Sub (Mult (EMA (Price, Fast Period), Sub (1,Div (2, Add (1, Fast Period)))), Mult (EMA (Price, Slow Period), Sub (1, Div (2, Add (1, Slow Period)))))), Sub (Sub (1, Div (2, Add (1, Fast Period))), Sub (1, Div (2, Add (1, Slow Period)))))

Function Name: Price Where MACD Is Equal To Zero
Short Name: PMACDzero
Inputs: Price, Fast Period, Slow Period

PMACDlevel (0, Price, Fast Period, Slow Period)

TRADECISION: REVERSING MACD
In his article “Reversing MACD” in this issue, Johnny Dough shows that the reversing MACD can be used to calculate the price value of a specific MACD level and the price value that will cause the MACD to change direction.
To recreate this technique, use Tradecision’s Function Builder to set up the following functions:
PMACDeq function:
function (price:numeric, period_x:numeric, period_Y:numeric):Numeric;

Var
alphaX:= 2 / ( 1 + period_X );
alphaY:= 2 / ( 1 + period_Y );
End_var

return ( EMA( price, period_X ) * alphaX - EMA( price, period_Y )* alphaY ) / ( alphaX - alphaY );

PMACDlevel function:
function (level:numeric,price:numeric, period_x:numeric, period_Y:numeric):Numeric;

var
alphaX := 2 / ( 1 + period_X );
alphaY := 2 / ( 1 + period_Y );
One_alphaX := 1 - alphaX;
One_alphaY := 1 - alphaY;
end_var

return ( level + EMA( price, period_Y ) * One_alphaY - EMA( price, period_X )* One_alphaX ) / ( alphaX - alphaY );

PMACDzero function:
function (price:numeric, period_x:numeric, period_Y:numeric):Numeric;
return PMACDlevel( 0 , price, period_X, period_Y );
To import the strategy into Tradecision, visit the area “Traders’ Tips from TASC Magazine” at www.tradecision.com/support/tasc_tips/tasc_traders_tips.htm or copy the code above.
A sample chart is shown in Figure 8.
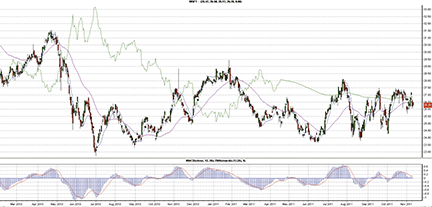
FIGURE 8: TRADECISION, MICROSOFT CHART WITH THREE PMACD INDICATORS PLOTTED. On this chart of MSFT, you see PMACDeq() of the closing price and two PMACD_MFT indicators of the closing price. The bottom panel displays the MACD indicators.

NINJATRADER: REVERSING MACD
The indicators described in Johnny Dough’s article in this issue, “Reversing MACD,” have been made available for download at www.ninjatrader.com/SC/January2012SC.zip.
Once you have downloaded them, from within the NinjaTrader Control Center window, select the menu File → Utilities → Import NinjaScript and select the downloaded file. This file is for NinjaTrader version 7 or greater.
You can review the indicators’ source code by selecting the menu Tools → Edit NinjaScript → Indicator from within the NinjaTrader Control Center window and selecting ReversingMACD or ReversingMACDHLC.
NinjaScript uses compiled DLLs that run native, not interpreted, which provides you with the highest performance possible.
A sample chart implementing the strategy is shown in Figure 9.
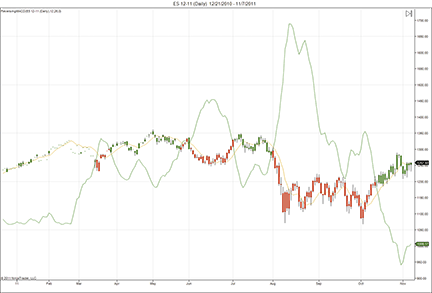
FIGURE 9: NINJATRADER, REVERSING MACD. This NinjaTrader screenshot shows Johnny Dough’s reversing MACD indicator applied to a daily chart of the emini S&P (ES 12-11).

TRADESIGNAL: REVERSING MACD
The PMACDZero indicator presented by Johnny Dough in his article in this issue, “Reversing MACD,” can be used with our online charting tool at www.tradesignalonline.com. At our site, check the infopedia section for our lexicon. You will see the indicator there, which you can make available for your personal account. Click on it and select “open script.” The indicator will be immediately available for you to apply on any chart you wish.
A sample chart implementing the indicator is shown in Figure 10.
PMACDZero.eqi

Meta:
		Weblink("https://www.tradesignalonline.com/lexicon/view.aspx?id=17663"),
	Synopsis("The PMACDZero Indicator, based on the 01/2012 TAS&C Article 'Reversing MACD"),
	AutoScale( False ),
	Subchart( False );
Inputs:
	Price( CLose ),
	MACD_Fast( 12 , 1 ),
	MACD_Slow( 26 , 1 ),
	MACD_Signal( 9 , 1 );
Vars:
	pmacdZeroValue;

pmacdZeroValue = PMACDZero( Price, MACD_Fast, MACD_Slow );

DrawLine[-1]( pmacdZeroValue, "PMACDZero", StyleSolid, 2, Black );
// *** Copyright tradesignal GmbH ***
// *** www.tradesignal.com ***

PMACDZero.eqf
Inputs:
	Price( NumericSeries ),
	PeriodX( NumericSimple ),
	PeriodY( NumericSimple );
PMACDZero = PMACDLevel( 0, Price, PeriodX, PeriodY );
// *** Copyright tradesignal GmbH ***
// *** www.tradesignal.com ***

PMACDLevel.eqf
Inputs:
	Level( NumericSimple ),
	Price( NumericSeries ),
	PeriodX( NumericSimple ),
	PeriodY( NumericSimple );
Vars:
	expectedPriceLevel, alphaX( 2 / ( 1 + PeriodX ) ), alphaY( 2 / ( 1 + PeriodY ) ), oneAlphaX( 1- alphaX ), oneAlphay( 1 - alphaY );

expectedPriceLevel = ( Level +  XAverage( Price, PeriodY ) * oneAlphay - XAverage( Price, PeriodX ) * oneAlphaX ) / ( alphax - alphay );

PMACDLevel = expectedPriceLevel;
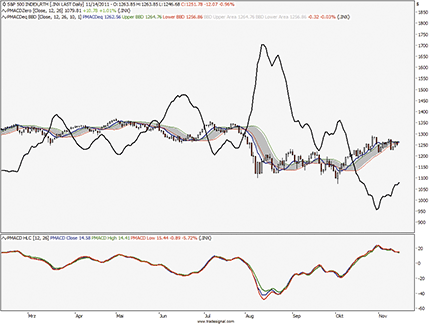
FIGURE 10: TRADESIGNAL, REVERSING MACD

UPDATA: REVERSING MACD
“Reversing MACD” in this issue, author Johnny Dough reverse-engineers the traditional MACD indicator to create two indicators. The first derives the price at the next bar required to cause the MACD to achieve a predefined value (in this instance zero). The second derives the price needed to cause the MACD to change direction.
The Updata code for both indicators has been added to the Updata Library. You can download it by clicking the custom menu and then either library. Those who cannot access the library due to a firewall may copy & paste the code shown here into the Updata Custom editor and save it.
A sample chart is shown in Figure 11.
'PMACDEqual
PARAMETER "MACD Period 1" #Period1=12
PARAMETER "MACD Period 2" #Period2=26
PARAMETER "Smooth Period" #Smooth=5
NAME "PMACDEq" ""
DISPLAYSTYLE 2LINES
INDICATORTYPE TOOL
PLOTSTYLE THICK2 RGB(50,50,255)
PLOTSTYLE2 THICK2 RGB(255,50,50)
@AlphaX=0
@AlphaY=0
@expAvgX=0
@expAvgY=0
@PMACDEq=0
FOR #CURDATE=0 TO #LASTDATE
   If #CURDATE>MAX(#Period1,#Period2)
      @AlphaX=2/(1+#Period1)
      @AlphaY=2/(1+#Period2)
      @expAvgX=EAVE(#Period1)
      @expAvgY=EAVE(#Period2)
      @PMACDEq=((@expAvgX*@AlphaX)-(@expAvgY*@AlphaY))/(@AlphaX-@AlphaY)
      @Plot=Hist(@PMACDEq,1)
      @Plot2=SGNL(@PMACDEq,#Smooth,E)
   EndIf
NEXT

'PMACDZero
PARAMETER "Level" #Level=0
PARAMETER "MACD Period 1" #Period1=12
PARAMETER "MACD Period 2" #Period2=26
NAME "PMACDZero" ""
DISPLAYSTYLE LINE
INDICATORTYPE TOOL
PLOTSTYLE THICK2 RGB(0,0,0)
@AlphaX=0
@AlphaY=0
@expAvgX=0
@expAvgY=0
@PMACDZero=0
FOR #CURDATE=0 TO #LASTDATE
   If #CURDATE>MAX(#Period1,#Period2)
      @AlphaX=2/(1+#Period1)
      @AlphaY=2/(1+#Period2)
      @expAvgX=EAVE(#Period1)
      @expAvgY=EAVE(#Period2)
      @PMACDZero=(#Level+(@expAvgY*(1-@AlphaY))-(@expAvgX*(1-@AlphaX)))/(@AlphaX-@AlphaY)
      @Plot=Hist(@PMACDZero,1)
   EndIf
NEXT
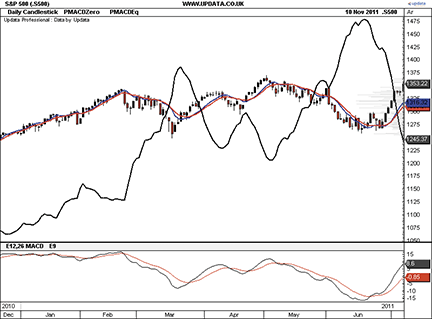
FIGURE 11: UPDATA, REVERSING MACD. In this chart of the daily S&P 500 index, the black line across the price data displays the price needed to cause the MACD to equal zero at the next bar (PMACDZero), and blue line is the price needed to cause a direction change in the MACD (PMACDEq), also at the next bar. The additional red line is a smoothed version of the PMACDEq.

SHARESCOPE: REVERSING MACD
This succinct piece of code provided here will add Johnny Dough’s reverse MACD analysis to an instrument’s price chart in ShareScope. We haven’t included the Bollinger Bands, but our customer support team can help you do this.
To download the ShareScope script, go to www.sharescript.co.uk/sharescript_library.php and look for ReverseMACD.ss under “technical analysis indicators.”
A sample chart is shown in Figure 12. The code follows:
reversingMACD.ss

//@Name:Reversing MACD
//@Description:Reversing MACD, as described in Stocks & Commodities Magazine, January 2012.
//@Type:Historical
//@Future:Yes
// Care has been taken in preparing this code but it is provided without guarantee.
// You are welcome to modify and extend it. Please add your name as a modifier if you distribute it.

//Coded by: Richard Chiesa, ShareScript Support

var macdShort = 12;
var macdLong = 26;
var signalPeriod = 9;
var macdEqSignal = 9;
function init(staus)
{
	setRange(Range.Parent);
	setSeriesLineStyle(0, 0, 1);
	setSeriesLineStyle(1, 0, 1);
	setSeriesLineStyle(2, 0, 1);
	//setSeriesColour(0, Colour.LightRed)
	setSeriesColour(1, Colour.LightRed);
	setSeriesColour(2, Colour.LightBlue);
}
function getGraph(share, data)
{
	var ma1 = new MA(macdShort,MA.Exponential);
	var ma2 = new MA(macdLong,MA.Exponential);
	var ma3 = new MA(macdEqSignal,MA.Exponential);
	var macd1 = new MACD(macdShort,macdLong,signalPeriod);
	var signal = [];
	var ema1 = [];
	var ema2 = [];
	var eqSignal = [];
	var fShort = 2 / (macdShort + 1);
	var fLong = 2 / (macdLong + 1);
	var macdZero = [];
	var macdEq = [];
	var macd
	for (var i=0; i0)
		{
			macdEq[i+1] = (((fShort-1)*ema1[i]) - ((fLong-1)*ema2[i]) + (ema1[i-1]-ema2[i-1])) / (fShort - fLong);
			eqSignal[i+1] = ma3.getNext(macdEq[i+1]);
		}
	}

	return [macdZero,macdEq,eqSignal];
}
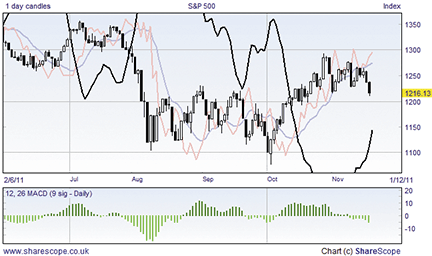
FIGURE 12: SHARESCOPE, REVERSING MACD
MICROSOFT EXCEL: REVERSING MACD
In his article in this issue, author Johnny Dough presents an interesting set of ways to turn the well-known MACD indicator inside out and use the resulting indicators to assist the eye when surveying a price chart.
The calculations necessary to recreate Dough’s indicators in Excel spreadsheet software are clean and simple. They lend themselves to straightforward spreadsheet cell formulas.
The Excel file I am providing this month includes indicator set calculations for each of the four price series. The sample chart in Figure 13 and the charts in Dough’s article elsewhere in this issue lean heavily on indicators built from the closing price series. Thus, that set is built first. You may mix and match from all of the sets to build additional charts.
Click here to download “ReversingMACD.xls.”
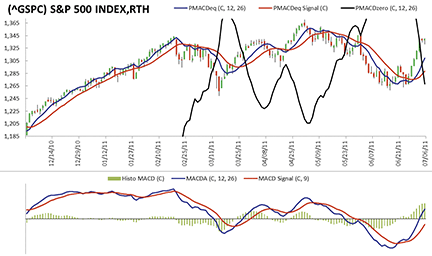
FIGURE 13: EXCEL, REVERSING MACD. Here is a sample chart of the S&P 500 with the MACD, PMACDeq, nine-period EMA of PMACDeq, and PMACDzero of the closing price.

AMIBROKER: REVERSING MACD — DOUGH ARTICLE CODE
AmiBroker code developed by Johnny Dough for his article in this issue, “Reversing MACD,” can be found in the Subscriber’s Area of the Stocks & Commodities website, Traders.com.