Letters To The Editor
February 2012 Letters To The Editor
The editors of S&C invite readers to submit their opinions and information on subjects relating to technical analysis and this magazine. This column is our means of communication with our readers. Is there something you would like to know more (or less) about? Tell us about it. Without a source of new ideas and subjects coming from our readers, this magazine would not exist.
Address your correspondence to: Editor, Stocks & Commodities, 4757 California Ave. SW, Seattle, WA 98116-4499, or E-mail to editor@traders.com. All letters become the property of Technical Analysis, Inc. Letter-writers must include their full name and address for verification. Letters may be edited for length or clarity. The opinions expressed in this column do not necessarily represent those of the magazine. —Editor
BEST-PERFORMING CANDLESTICKS
 Editor,
I read the article “The Eight Best Performing Candles” by Thomas Bulkowski in your November 2011 issue. I found it interesting that the bullish reversal pattern called three inside up was one of the top two best-performing candles. The other one, the above the stomach, I have never heard of, and I have most of the Japanese literature translated from 20 years ago. However, I’m sure there are some that I missed.
Your readers should know that the three inside up pattern was not an actual Japanese candle pattern but one that Norm North and I created about 20 years ago in an attempt to improve the performance of the bullish harami. We did this by adding an extra day to the harami, which gave a closing price above the second day’s body. And yes, it works quite well. There is also a three inside down pattern to enhance the bearish harami, and there are three outside up and down patterns to improve the bullish and bearish engulfing patterns.
Congratulations to Bulkowski for continuing his research on Japanese candle patterns. I especially agree with his comment about avoiding single-line candle patterns, as I say they should neither be traded nor ignored. However, there is always a message.
GREGORY L. MORRIS
Greg Morris is author of Candlestick Charting Explained and Candlestick Charting Explained Workbook.—Editor
ABZ’ TEST
Editor,
Jacinta Chan’s recent article “The Adjustable-Bands Z-Test” (December 2011 S&C) presents a further development of her March 2006 S&C article, “Trading Trends With The Bollinger Bands Z-Test.”
Chan clearly explains the theory and parameters for the ABZ’ test, but unfortunately, she does not show the actual calculation of the parameters that lead to the results presented in her article. I carefully modified my own Microsoft Excel spreadsheet calculations for her original Bollinger Bands z-test to implement the calculations for her ABZ’ test in Excel, but the result is a ponderously slow and ineffective ABZ’ value. Would it be possible for her to clarify the actual ABZ’ test calculations?
S&C is a great magazine — I have subscribed continuously from the first issue published!
DANIEL McCLEAN
North York, Ontario, Canada
ABZ’ uses the efficacy ratio to adjust its parameters, the moving average, and standard deviation to try to gain earlier entry into a new trend or avoid whipsaws in a ranging market.
The efficacy ratio is the long-term standard deviation divided by the short-term standard deviation. In the case of my December 2011 article, it is 34 days’ standard deviation divided by six days’ standard deviation.
If the ratio is too small or insignificant a parameter, you may wish to multiply it by 10. The ratio is then used to adjust the length of the moving average and standard deviation bands — that is, if the efficacy ratio is 6, you would use a six-day moving average and a six-day standard deviation. You may also wish to cap the efficacy ratio to 34 (or whatever the long-term standard deviation is).
ABZ’ uses the formula (close � moving average)/standard deviation.
If ABZ’ is above 0.8, then it suggests a long position. If ABZ’ is below -0.8, then this suggests a short position. Do not trade inside the bands.
Note that 34 and 6 are arbitrarily chosen. A lot more research needs to be done to select these parameters by algorithm(s).
I hope this answers your question.
JACINTA CHAN
P.S. Thank you for writing, and congratulations on subscribing for 30 years! Hearing from charter subscribers warms our hearts!—Editor
COACH YOURSELF TO TRADING SUCCESS
 Editor,
I read Jamie Theiss’ article “Coach Yourself To Trading Success” in the November 2011 S&C and have to say it was one of the best articles I have ever read in S&C.
On the Readers’ Choice ballot at Traders.com, I voted for it to be the No. 1 article of the year. This type of material is really lacking in trading publications today, where there is too much focus on technical indicators or this or that new technique. I hope to read more articles like this in the future in S&C.
PATRICK
Thank you for your article feedback. We have received several similar reader comments lately expressing the desire for more articles on trading psychology and articles that offer practical advice on trading successfully rather than articles that detail technical trading strategies.
By contrast, see also the next letter to the editor, which has the opposite viewpoint. It goes to show we can’t please all readers all the time, and the best we can do is to try to include a variety of articles in each issue as well as over the course of a year.—Editor
NEED MORE TECHNICAL STUFF
Editor,
I don’t see that S&C has been any help to me for the past few months. What I really like is The Encyclopedia Of Technical Market Indicators by Robert Colby.
Since the time that book was first published, there have been many new techniques, published in magazines like yours. The problem with the articles in your magazine is there is more fluff than the real stuff needed to build an indicator’s strategy. What I am looking for is “indicator to strategy” step-by-step instructions, as noted in Colby’s Encyclopedia.
Do you have any paper versions or electronic versions of indicators and strategies from all the articles published in your magazine? Note I am not looking for the entire original articles, some of which are not to the point and do not give tools to build indicators and strategies like Colby’s book does.
B. GANDHAVADI
Brookfield, WI
Sorry, we do not offer electronic versions of all the indicators discussed in our pages since we are not a software developer. Moreover, we do not offer paper versions of all the indicators discussed in our magazine since that would be redundant to what our articles cover, as most articles do detail the logic of an indicator discussed in the article or provide formulas for implementation.
In addition, we publish our Traders’ Tips section every month, in which a variety of software developers provide software code to implement a selected technique from that issue. We offer a collection of Traders’ Tips at our website, www.traders.com, going back to 1996.
With its how-to nature, this magazine’s mission has always been to present articles detailing techniques that the reader can implement, replicate, or recreate. This is obviously not possible for every article, and not every article in the magazine sets out to present a new indicator, but this is an overall goal for our publication, and I think you will find that many articles provide the technical details you seek.
All readers should keep in mind that current subscribers now have online access to our entire article archive. Readers interested in pursuing a particular indicator or strategy can perform a search for it at our website; review past research on a topic; look up the formulas or logic for a publicly available indicator; and access published code to implement techniques.—Editor
CANADIAN READER
Editor,
I just came across your publication. I am curious to ask how applicable your articles may be to me in Canada.
PETER
A number of our authors (both for our print magazine, S&C, and our online publications, Traders.com Advantage and Working Money) are Canadian, write from their homes in Canada, and refer to the Toronto exchange, so you will find some familiar territory there.
In addition, many technical analysis techniques are applicable to a variety of markets or tradables.—Editor
CONCERNS OVER REGULATIONS
Editor,
I’ve been reading S&C magazine off and on for several years. I’m hoping that you folks might be able to address my questions/concerns about the future of the daytrading industry.
After the financial markets collapsed in 2008, it appeared that a wave of overzealous regulation would destroy the viability of daytrading for the retail-level trader. Now there are rumblings of more regulation. I am extremely concerned about the viability of the daytrading industry in both the near-term and long-term future. Do you believe that daytrading will continue to be viable in both the near-term and long-term future? Will upcoming regulation squash the industry entirely?
WATSON
As it so happens, Don Bright’s column in the January 2012 issue covered this topic. Personally, I don’t think the daytrading industry will get squashed. Nonetheless, it is a good idea to keep abreast of changes in regulation. Here is one website you can visit for updates: https://www.defendtrading.com/.—Editor
OBLIQUE TRENDLINES?
Editor,
I am new to S&C but not new to trading. I am very impressed by the magazine and the quality of articles and topics. Certainly enough to keep me busy with my reading for a while!
I was wondering if you have ever run an article on how to draw oblique support and resistance trendlines (some people call them vectors). There is an option when using the ProRealTime.com charting software to show these lines, and I have found them very useful for my directional trading. I have a handle on drawing horizontal trendlines, but I am wondering what the rules are for drawing the oblique lines — they look trickier. Do you know where I can get further information or articles on this topic?
DAVID
Canterbury, England
You could try searching our website at www.traders.com for this topic or terms related to oblique trendlines. If you are a subscriber, then you have access to all past articles, downloadable as PDF files.
While we have published many, many articles related to trendlines (simply type “trendline” into the search box at our website and view all the results), we may not have published anything on drawing oblique lines, outside of the Andrews method, the pitchfork technique, Gann lines, and speed lines. Here are a few articles that may be of interest.—Editor
- “Trendline Basics” by Martin Pring (March 2000)
- “Trading Andrews Lines” by John Chandler (December 2000)
- “Trading Trendline Breaks,” parts 1 and 2, by Sylvain Vervoort (July 2007 and September 2007)
- “Fitting A Trendline By Least Squares” by Arthur A. Merrill (July 1988)
- “The Instantaneous Trendline” by John F. Ehlers (February 2002)
MARKET INSTRUMENT FUNCTION
Editor,
I enjoyed the December 2010 S&C article on the market instrument function by Alexander Ershov and Aleksey Gerasimov.
It appears that the function is not following or predicting the Dow Jones or S&P as closely as in the past. Is this a normal expectation, or has the formula changed?
GARY TREBERT
Authors Aleksey Gerasimov and Alexander Ershov reply:
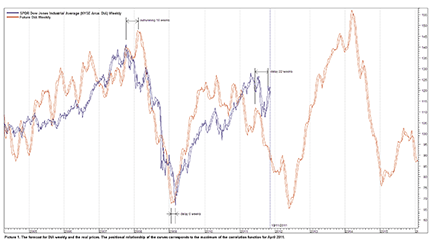
The formula for the market instrument function stays the same. The problem is that the events were delayed. This delay is 22 weeks.
This is a normal situation. In 2008, the delay was 35 weeks. With the method of the market instrument function, we can describe only the long-term movement of the market. Some of the events may happen earlier; some, later. However, this circumstance does not change the general form of the future graph.
While using the market instrument function method, it is necessary to determine the point of the forecast that corresponds to the current date. As a rule, the forecast reproduces the market’s fine structure poorly. Thus, the positional relationship of the curves is determined from the maximum of the correlation function for the forecasted and actual prices.
In Figure 1, you can see both the forecasted DIA weekly prices and the actual prices. The positional relationship of the curves corresponds to the maximum of the correlation function as of April 2011.

FIGURE 1: DIA WEEKLY. Here, you see actual (blue) and forecasted (red) prices as of April 2011.
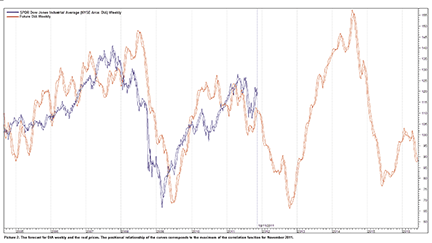
In Figure 2, you can see the forecasted DIA weekly prices and the actual prices. The positional relationship of the curves corresponds to the maximum of the correlation function as of November 2011. From Figure 2, you can see that the price minimum in the market will happen not in August 2012 but in mid-autumn.

FIGURE 2: DIA WEEKLY. Here, you see actual (blue) and forecasted (red) prices as of November 2011.
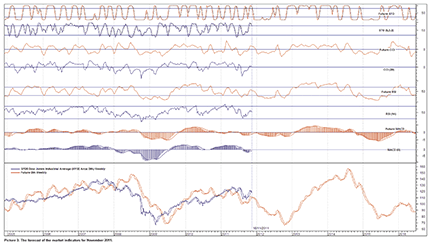
In Figure 3 we show the forecast for a variety of market indicators as of November 2011.

FIGURE 3: INDICATORS. Here, you see forecasted indicator values using the market instrument function method.
Aleksey Gerasimov can be contacted at avgerasimov@umail.ru and Alexander Ershov at amershov@umail.ru.