QUANTITATIVE ANALYSIS
Incorporating Biases
The Overnight Return Study
Anomalies in the markets appear on occasion and challenge the efficient market hypothesis. Here’s a look at the overnight return anomaly, with some findings that may surprise you.
Many within the financial community believe that the markets follow the efficient market hypothesis. This theory asserts that the current price of a security reflects all public and private information about that security. Changes in price are due to current news or events, which are impossible to predict. Thus, a tradable follows the path of a random walk, the premise of which states that current prices are not dependent on past prices and are normally distributed over time.
Over the years, many studies have presented data about what academics call “market anomalies.” These anomalies appear from time to time and challenge the efficient market hypothesis. There are three common classifications: fundamental, technical, and calendar-based. There is another class of anomaly that most people simply refer to as “other” for those that do not fit into the original three. In this article we will discuss one of these “other” market anomalies, called the overnight return.

Can you make returns overnight?
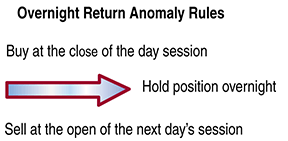
Day versus overnight returns can be studied by analyzing the differences in returns between the day’s session (defined here as regular NYSE trading hours) and the overnight period. In testing the returns for the day and overnight periods, we used the SPDR S&P 500 exchange traded fund (SPY), which has historical data going back to February 2, 1993. We can define the day’s return as the difference between the day’s open and the day’s close. The overnight return is the difference between the day’s close and the following morning’s open.
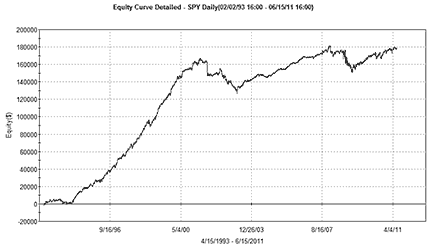
It is a common misconception on the part of most market participants that the majority of returns from day-to-day trading are extracted from the daytime period, rather than from the overnight. This would make sense, as more people track the daytime price action as opposed to the overnight price action. But as Figures 1 and 2 indicate, the opposite is true of day versus overnight returns.

FIGURE 1: SPDR S&P 500 ETF, 2/2/1993 TO 6/15/2011. Here you see the equity curve of overnight returns (today’s open — yesterday’s close) of $100,000 invested per trade. Transactions don’t include commission or slippage costs.