AT THE CLOSE
Trading Momentum
Can one indicator be powerful enough to indicate momentum?
Most traders or investors using technical analysis to manage their portfolios use an array of indicators, and chances are they use some form of momentum. Generally, a technical analyst will combine a momentum indicator with one or more other technical indicators, such as volume, or price range indicators. An experienced technical analyst will avoid combining indicators that use the same information to trigger. For example, the moving average convergence/divergence (MACD), relative strength index (RSI), and stochastics all use the same information to trigger entries and exits. Therefore, combining them can be misleading since they are not independent variables. Combining indicators goes beyond the scope of this article, so I will keep it simple and focus on momentum alone.
Moving average convergence/divergence
One of the most popular price momentum indicators is the MACD, developed by Gerald Appel. Many investors understand how to interpret the MACD, but too many do not understand the basic calculation. Understanding the calculation, in my opinion, is essential in the interpretation of the indicator. The name may be difficult to say, but the calculation itself is simple.

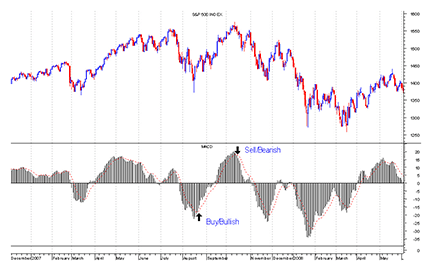
FIGURE 1: STANDARD MACD. When the MACD crosses or is greater than the nine-day EMA of MACD, a buy signal occurs. When the MACD crosses below the nine-day EMA of MACD, a sell signal occurs.