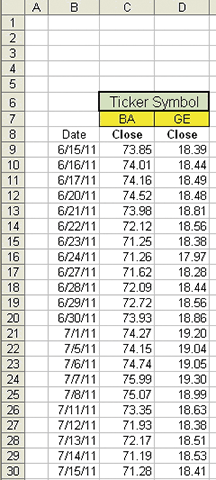
FIGURE 1: ENTER SERIES OF PRICE DATA. Here you see the closing price data for Boeing Co. (BA) and General Electric (GE).
AT THE CLOSE
Build a spreadsheet to aid in revealing profitable opportunities in pair trades.
Pair trading is classified as a market neutral strategy where you are not concerned with market direction, whether up or down. Instead, the idea is to exploit temporary price discrepancies in two (or more) securities by simultaneously going long the outperforming security and going short the underperforming one.
An important concept in pair trading is in selecting securities that have a spread with a “mean reverting” (comovement) characteristic. Correlation of the two securities was often used as a measure to find similarity in the movement of two or more securities. Correlation is not always indicative of mean reversion. Cointegration is a more accepted method for detecting mean reversion — that is, comovement — of the spread in securities.
Other than knowing that cointegration is a way to measure comovement or mean reversion, it is not necessary to go into detail about it here. There are commercial software packages and web services that will perform cointegration analysis on a pair of stocks. In addition, there are free scripts for Matlab and “R,” the free language and environment for statistical computing and graphics, that will perform the cointegration calculations.
For this article I have constructed an Excel spreadsheet to aid in identifying the spread in a pair of stocks that have a mean reversion characteristic that can be traded profitably.

FIGURE 1: ENTER SERIES OF PRICE DATA. Here you see the closing price data for Boeing Co. (BA) and General Electric (GE).