SWING TRADER
Factor Of Five
Fractal Energies
by Doc Severson
Learning how to read the swings within the swings and understanding how much energy is available in these time frames are keys to survival in today’s markets. Here’s how you can apply an obscure indicator and plain, old-fashioned price action to anticipate market movements.
Do technical indicators work any more? When was the last time you saw a stochastic or moving average convergence/divergence (MACD) crossover lead to a good entry? When was the last time a relative strength index (RSI)(14) signal below 30 led to a great buy signal, or a rise above 70 led to a solid sell signal? Most of the time we see oscillators saturate on long bull runs, as what becomes overbought can remain overbought, and during choppy price action, we’ll see longer-term RSI just stay between the 30 and 70 levels for months at a time. The signals that were sold at educational seminars five to 10 years ago simply don’t provide any edge in today’s market.
Taking it a notch higher
So the next level of sophistication that a typical retail trader learns is to anticipate leading signals on oscillators or MACD histograms by reading divergences. A higher high in price with a corresponding lower high in the indicator can often be a signal that momentum is tiring and a reversal is imminent. And there was some truth to that a few years ago in the choppier, low-volatility markets that we saw in 2004–07.
Since then, however, the unique characteristic about how markets operate today is that we’re seeing more extended swings that seem to have no end. In markets that show long swings, each restoring pullback will automatically generate a lower high on the indicator and give you a false reading that a reversal is around the corner.

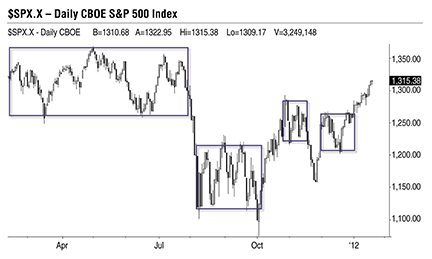
FIGURE 1: CONSOLIDATION ZONES. The consolidation zones marked by the boxes are serving to coil energy like a spring until it finally releases. The longer the coil, the larger the buildup of potential energy, which in turn leads to an eventual release of kinetic energy in the form of a sharp trend.
Excerpted from an article originally published in the May
2012 issue of Technical Analysis of Stocks & Commodities magazine. All rights reserved. © Copyright 2012, Technical Analysis, Inc.
Return to Contents
