INTERVIEW
Interview On A Theme
David Vomund And The World Of Exchange Traded Products
by Jayanthi Gopalakrishnan

David Vomund is the president of Vomund Investment Management, an investment advisory company that specializes in managing exchange traded fund (ETF) portfolios. While other advisory firms are only now discovering ETFs, Vomund’s firm has an exceptional nine-year track record of ETF trading.
With more than 20 years of investment and portfolio management experience, he is a frequent speaker at national investment conferences. Vomund’s analysis and forecasts have appeared in many publications such as Active Trader, Los Angeles Times, and Barron’s, and he was our interview subject previously, in the October 1999 issue of Stocks & Commodities.
The author of two highly acclaimed books, ETF Trading Strategies Revealed and Exchange Traded Profits, Vomund is methodical and practical in addressing both the technical and behavioral approaches to investing. Several of the methods discussed in these books are applied to his management account program. He also publishes VIS Alert.com, a weekly newsletter that covers market timing, ETF rotation, and stock selection.
This interview was conducted via email, with S&C Editor Jayanthi Gopalakrishnan sending a series of questions to Vomund. The interview was completed on April 16, 2012.
David, how did you get interested in technical analysis?
You know how your first job after college is always very important in determining your future direction? My first job was in the technical research department for a small investment newsletter company. I am a numbers guy so it suited me well, but this was in the mid-1980s, so a lot of the work was by hand. We had some impressive-looking point & figure charts! A bull market was on, so we had to tape graph paper to the top of existing charts because prices were literally going off the charts. We also did a lot of work with sector rotation, something that is still important in my analysis.
What led to your interest in exchange traded funds?
We have to learn from every bear market so that mistakes are not repeated. I learned from the 2000–03 bear market that you need to be flexible in the type of analysis that you use. For example, growth investors did very well in the 1990s, but then value investors fared better in the early 2000s. Along the same lines, the large-cap stocks in the NASDAQ 100 performed best in the 1990s, but small-cap stocks performed best in the early 2000s.
ETFs gave me the flexibility to employ whatever style of investing was in favor at the time.As market conditions change, your trading style will move into and out of favor. We have to be flexible, but that is easier said than done. It is hard for a growth investor to employ a value strategy, and it is hard for a value investor to employ a growth strategy.
I am a growth investor so it goes against my nature to buy undervalued, high-yielding value stocks. That’s where ETFs come in. Instead of forcing myself to become a value investor when growth investing is out of favor, I can just buy a value ETF.
So in 2003 I began a managed account program that used mechanical strategy to, in effect, jump around the Morningstar box. If large-cap value stocks are leading, then I’ll own a large-cap value ETF. If small-cap growth stocks are in favor, then I’ll buy a small-cap growth ETF.
ETFs gave me the flexibility to employ whatever style of investing was in favor at the time. Nearly 10 years later, the portfolios, after all the fees, have almost doubled in value.
You have done a lot of work with ETFs, publishing a couple of books on the subject. How is trading ETFs different from trading equities or futures?
In many ways it is the same. The chart patterns that we employ on stocks can also be used on ETFs. The price-based indicators that are used on stocks, such as moving averages and stochastics, can also be used on ETFs.

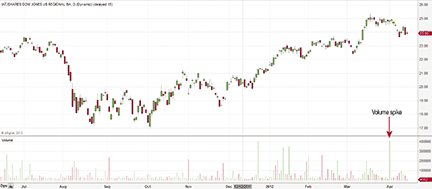
FIGURE 1: DAILY CHART OF ISHARES DOW JONES US REGIONAL BANKS ETF (IAT). Note the volume spike that was four times higher than average on April 2, 2012. The underlying holdings of the ETFs were mostly flat on that day, however, with less than normal volume. Since the price movement of the ETF is based on the underlying stocks, you would add up the volume of the top 10 holdings of the ETF on that specific day and apply the lower volume figure to your analysis.
Excerpted from an article originally published in the June 2012 issue of Technical Analysis of Stocks & Commodities magazine. All rights reserved. © Copyright 2012, Technical Analysis, Inc.
Return to Contents

