 Editor,
I was going through the May 2012 article on the choppiness index (“Fractal Energies” by Doc Severson) and the code given for thinkorswim. I have copied & pasted the code from the article, but it’s giving me an error at the following line:
LETTERS TO THE EDITOR
The editors of S&C invite readers to submit their opinions and information on subjects relating to technical analysis and this magazine. This column is our means of communication with our readers. Is there something you would like to know more (or less) about? Tell us about it. Without a source of new ideas and subjects coming from our readers, this magazine would not exist.
Address your correspondence to: Editor, Stocks & Commodities, 4757 California Ave. SW, Seattle, WA 98116-4499, or E-mail to editor@traders.com. All letters become the property of Technical Analysis, Inc. Letter-writers must include their full name and address for verification. Letters may be edited for length or clarity. The opinions expressed in this column do not necessarily represent those of the magazine. —Editor
Steve Ward, the founder of Ward Systems Group and a longtime friend to Technical Analysis, Inc., passed away on March 20, 2012, after a short illness. Steve worked in the field of information technology for years, starting in college. He began Ward Systems Group in 1988 to bring what was then the new science of artificial intelligence into everyday application for business and science. He will be missed.
 Editor,
I was going through the May 2012 article on the choppiness index (“Fractal Energies” by Doc Severson) and the code given for thinkorswim. I have copied & pasted the code from the article, but it’s giving me an error at the following line:
#Plot1(100 * Log(Summation (TrueRange,Len) / (Highest(C[1],Len)
        - Lowest(C[1],Len)) / Log(Len)), "CI2");
Can you help?
John Parbhu
Author Doc Severson replies:
That instruction needs to be on one line for it to work correctly.
If you format that line of code so that it is entered in thinkorswim as one line, it will work fine. I will show the code listing again here, with the command in question highlighted in red, but keep in mind it is difficult to show the code listing correctly on the printed page with the formatting and line breaks that the printed page imposes.
# { CI: Choppiness Index }
declare lower;

# Inputs: Len(13);
input Len = 14;
input CIx = {default CI3, CI2};

#Plot1(100 * Log(Summation(TrueRange,Len)/(Highest(C[1],Len) - Lowest(C[1],Len))/Log(Len)), "CI2");
def CI2 = 100 * log( Sum( TrueRange(high,close,low),Len)
                  ) / ( Highest(close[1],Len) - Lowest(close[1],Len))
/ log(Len);

def CI3 =  ( ( log(Sum(TrueRange(high,close,low),Len) /
                   (
                      Highest(if high >= close[1] then high else
close[1],Len) -
                      Lowest( if low  <= close[1] then low  else close[1],Len)
                   )
                 ) / log(10)
             ) / (log(Len)/log(10))
           ) * 100;

plot CI = if CIx == CIx.CI3 then CI3 else CI2;
CI.AssignValueColor( Color.Blue);

# Plot2(60,"60Li");
plot line60 = 60;
line60.AssignValueColor(Color.DARK_GREEN);

# Plot3(35,"35Li");
plot line35 = 35;
line35.AssignValueColor(Color.BLACK);
Editor: Subscribers will find this code listing at the Subscriber’s Area of our website.
Editor,
After reading “Simple Strategy With 80% Winners” by Mike Carr (published in your companion online publication, Traders.com Advantage in May 2012), I had been unable to replicate the author’s results satisfactorily.
I had been testing Carr’s strategy from the article using TradeStation’s EasyLanguage and data from Worden Brothers, along with several strategy variations, but ended up with a large disparity between our test results.
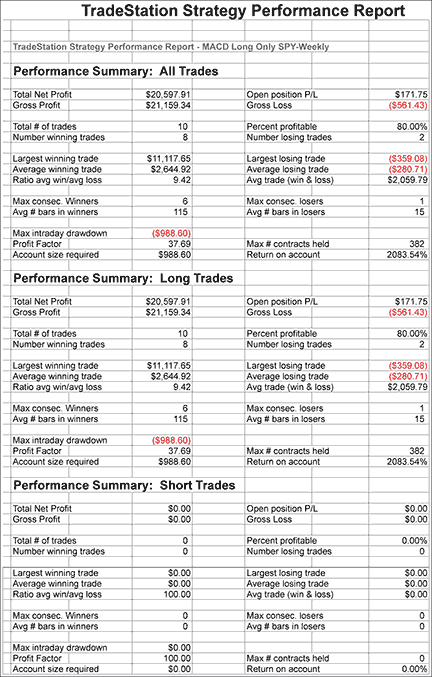
However, I believe I have now resolved this discrepancy. By adding a requirement for the MACD signal line to be in agreement with the MACD histogram — that is, both indicators above zero for entering a long position and both indicators below zero for exiting the trade — the number of trades is reduced from 47 to 10, and the percentage of profitable trades increases from 43% to 80%. In addition, the strategy’s key performance statistics — profit factor, win/loss ratio, maximum drawdown, and so on — all improve dramatically.
I believe the results I have obtained are now more closely in line with those stated in the article. Here is the EasyLanguage code I used in testing the strategy:
Variables:
macdLine(0),
macdSignalLine(0),
macdh(0);

macdLine = MACD(Close, 12, 26);
macdSignalLine = XAverage(macdLine, 9);
macdh = macdLine - macdSignalLine;
If macdSignalLine > 0 And macdh > 0 Then Buy Close;
If macdSignalLine < 0 And macdh < 0 Then ExitLong Close;
I have attached the compiled test results from TradeStation (see Figure 1 below) as well as the data I used in testing [not shown].
Donald Byrge
Thank you for sharing your experiences with your testing of this strategy, which may help other readers. S&C subscribers will find Carr’s May 2012 article in the Traders.com Advantage area of our website at here, or click on the Traders.com Advantage button from our home page at Traders.com and search for Carr’s article. —Editor

FIGURE 1: SYSTEM TEST RESULTS. Reader Donald Byrge provided these sample backtest results based on Mike Carr’s May 2012 Traders.com Advantage article, “Simple Strategy With 80% Winners,” at Traders.com. After originally getting different results from the author, he added a requirement in the author’s EasyLanguage code for the MACD signal line to be in agreement with the MACD histogram, and this modification brought his results in line with the author’s, he reports. Subscribers will find this code at the Subscriber’s Area at Traders.com.