AT THE CLOSE
Sidestepping The Next Crash
by Barry D. Moore, MSTA
It may seem like it’s too good to be true, but it is common sense and it is simple. What is it?
The biggest fear that financial market participants have is the threat of losing their money in a crash. With that in mind, I decided to write about a system that will help people deal with this concern and allow them to sleep at night.
The stock market crash detector, is made up of two signals, the shock event warning and the bear market signal. The bear market signal will help you spot a market crash just as it begins so you may exit the market with only a minor loss. The shock event warning allows you to see abnormal changes in stock market prices, so you may need to prepare for a crash. I will also show you a simple way to implement the system.
The stock market crash detector
During volatile times when no one knows which way the market is going to turn, it becomes increasingly important to formulate your approach. If the market crashes, it does not really matter what stocks you have bought, because they will get dragged down too. Wouldn’t it be nice if you had some sort of early warning system to let you know that there may be a serious crash on the way?
I have spent some time developing a system that will warn me when a potential crash is coming and when there will be a shock in the market (usually a precursor to a crash). I have backtested the system over the past 20 years and found it to work very well. I developed this system using Worden Brothers’ Stock Finder. Using three different indicators, I can spot the conditions that lead to a large stock market crash.
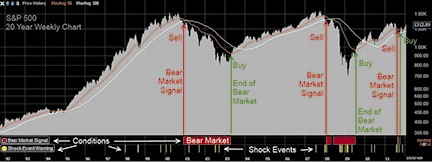
In Figure 1 you see the weekly chart of the Standard & Poor’s 500 from 1992 to 2011. There are two conditions below the price history of the S&P 500. A condition is a set of factors that combine to create a signal: a buy signal, sell signal, or a warning.

FIGURE 1: BEAR MARKET SIGNAL ON THE S&P 500. On this weekly chart of the S&P 500 from 1992 to 2011, there are two conditions below the price history of the S&P 500. The bear market signal (red) alerts you to a serious stock market decline. The shock event warning signal (yellow) lets you know when there has been a shock event in the stock market that negatively affected price.
Excerpted from an article originally published in the July
2012 issue of Technical Analysis of Stocks & Commodities magazine. All rights reserved. © Copyright 2012, Technical Analysis, Inc.
Return to Contents
