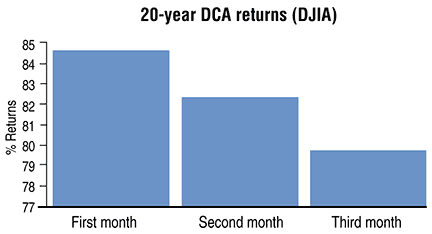
FIGURE 1: 20-YEAR DCA DOW RETURNS. If you invested in the first week of the first month in each quarter, then you achieved an 85% return. If you chose to enter on the first week of the third month in every quarter, your return was reduced to 80%.
MONEY MANAGEMENT
Better Results?
Passive investment strategies such as dollar cost averaging are back in fashion, but do they deliver as promised?
The flood of capital into exchange traded funds (ETFs) reflects a disillusionment with fund managers and investment funds. It also reflects a growing feeling that the market has become too difficult to trade. Passive investment strategies such as dollar cost averaging are back in fashion as an antidote to volatility. But do they deliver as promised?
Dollar cost averaging (DCA) is an investment strategy frequently recommended by fund managers. It encourages people to add the same amount of cash each month to a portfolio, a fund, or an individual stock. By doing so, the investor is supposed to overcome the difficulties of timing the market. In good times his cash buys less, and in bad times it buys more. The dollar cost of each purchase averages out.
Many claims are made for DCA. Some of these claims of outperformance are based on activities that are not dollar cost averaging, however. DCA theory requires the investor to allocate the same amount of cash on a regular basis at a consistent time interval. Its primary purpose is to avoid the need for market timing and asset allocation — picking the best sectors. DCA is not:
Dollar cost averaging is critically dependent upon the time you start the process. DCA is sensitive to the time you enter the market on a regular basis. The results can be substantially different, particularly over the 10- and 20-year longer time frames typically advocated by DCA investors. Several key claims are made, among which are that DCA is independent of market timing so results are much the same no matter what time the market is entered, and that it delivers at least market performance.
FIGURE 1: 20-YEAR DCA DOW RETURNS. If you invested in the first week of the first month in each quarter, then you achieved an 85% return. If you chose to enter on the first week of the third month in every quarter, your return was reduced to 80%.