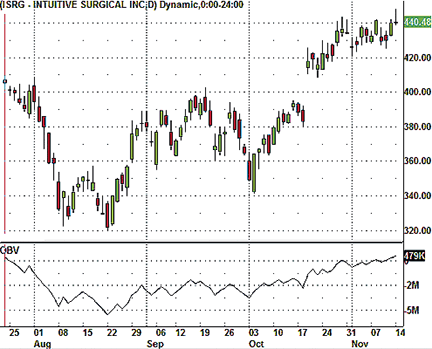
FIGURE 1: TECHNICALLY DERIVED VOLUME INDICATORS. Here you see the OBV applied to the daily chart of Intuitive Surgical Inc. (ISRG). The OBV can be used to identify divergences and anticipate reversals.
TRADING TECHNIQUES
Using Volume, Differently
Just about every trader uses volume. How can you use it?
There are many ways to use technical analysis to generate profitable trades with enticing risk/reward ratios. However, the sellers of technical analysis-based products often exaggerate the power of simple technical tools. To succeed as a trader, you must not only apply your methods properly but also use your technical tools in a different way than others do. In this article, you will discover a new method for analyzing volume and how it can be applied to a trading strategy to be used on multiple time frames.
Volume
Volume is one of the most important tools in trading. Every type of market participant, whether trader or investor, uses volume. Volume shows how many shares of a stock have been traded in a given period of time. Price bars with high volume are more informative than those with low volume. Many patterns emerge out of volume bars, and many technical tools are also derived from volume.
One important factor in generating a good risk/reward ratio is trading the right stocks. You want to trade stocks that are active. It is generally accepted amid technicians that an increase in volume leads to an increase in volatility.

FIGURE 1: TECHNICALLY DERIVED VOLUME INDICATORS. Here you see the OBV applied to the daily chart of Intuitive Surgical Inc. (ISRG). The OBV can be used to identify divergences and anticipate reversals.