MARKET ANALYSIS
Macro Perspectives
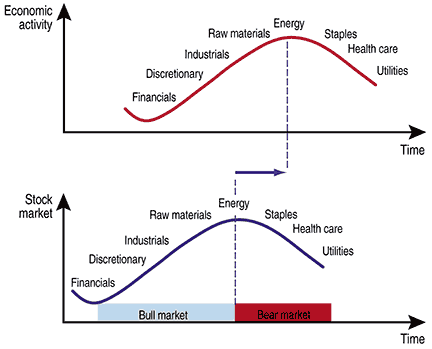
Two simple tools can help you incorporate the macro perspectives of the stock market in your technical analysis: the sector rotation model and the yield curve. Both are based on macro fundamentals, both have a technical application, and both have signals that usually precede major market reversals and highlight signals from classic technical analysis. In this article I will explain the logic of the first, the sector rotation model, and present a simple indicator to monitor its waves.
A market sector is a group of companies conducting similar types of business, and a sector rotation model (SRM) is a paradigm that describes which sectors are expected to be the most active during various periods of the economic cycle. Since business activity for the companies translates to more revenue, an SRM has implications in the profitability of sectors. Thus, an SRM could be used to find the top-performing sectors in the stock market. While there is no common acceptance of an SRM, all variations have minor differences so they come under the same name: the sector rotation model.
In this article I will first outline the necessary macroeconomic concepts that will help explain the logic and the basic parts of the SRM. Then I will introduce an indicator based on the SRM that can strengthen long-term technical analysis signals for the stock market.
Not always the root of evil
For the companies to make money, they must sell goods or services. As long as there is sufficient money in the marketplace and no fear of disasters, people can consume and companies can sell.
Moreover, since banks conduct business by borrowing and lending, they are more willing to lend with lower interest when they have excess money. So when there is plenty of money around, people and companies borrow money from the banks to satisfy their needs and make investments. Investments create jobs, which provide salaries and further boost economic activity.
While money is not a precondition for people to prosper, history and common sense teaches us that its use as a medium of exchange facilitates economic activity in free economies by encouraging borrowing and lending.
There are therefore two necessary conditions for the activation and sustainability of economic activity and, as expected, uptrends in the stock market: sufficiently available money and movement of money.

FIGURE 1: THE SECTOR ROTATION MODEL. Here you can see a pictorial illustration of the economic cycle (upper chart) aligned with the stock market cycle (lower chart) and the best sectors in terms of activity (for the economic cycle) and market performance (for the market cycle). Since the markets are discounting mechanisms, the stock market usually leads the economy by some months.