OPTIONS
That Is The Question
To Cover Or Not?
by Markos Katsanos
Covered call writing is one of the most popular option strategies, but there is, of course, a catch. This variation will reduce risk and increase profitability and compare it with related call writing strategies.
Covered call writing has been around for a while, and it may be the most commonly used option strategy, as many investors believe that it produces income without the unlimited risk of naked option writing. In this method, the option investor buys the underlying issue and writes (sells) call options on that same stock in order to generate additional income from the option premium. This strategy has lured many investors and even fund managers, but there is a catch, because there is no such thing as free money on Wall Street.
While covered calls can be a great way to generate income in a flat or moderately up market, the risk in today’s highly volatile market should not be overlooked, as the downside protection that covered calls can create is only the amount of premium received.
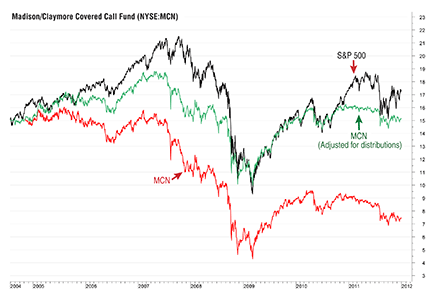
The notion that you can enhance your income by writing calls against your portfolio is a delusion because it ignores the damage to your underlying stock portfolio. There is an easy way to find the extent of this damage by looking at the performance of one of the covered call exchange traded funds (ETFs) trading on the NYSE. In Figure 1, you can see a chart of the Madison/Claymore Covered Call Fund (MCN) superimposed on the Standard & Poor’s 500. I have also plotted the same ETF adjusted for distributions (in green).

FIGURE 1: CHART OF THE MADISON/CLAYMORE COVERED CALL FUND (MCN, IN RED) FROM INCEPTION (AUGUST 19, 2004) TO THE END OF 2011. The green line depicts MCN adjusted for distributions. The S&P 500 (in black) is not adjusted for dividends. MCN consistently underperformed the S&P 500, especially in bullish market conditions.
You can see the damage that option writing does to your principal in the unadjusted MCN (in red). It underperformed the S&P 500 since inception and it has not come anywhere close to recovering to its IPO level. In fact, even after taking into account dividends and distributions (in green), it barely broke even during the seven and a half year period (from August 19, 2004, to December 3l, 2011) compared to a 34% total return for the S&P 500.
Excerpted from an article originally published in the September
2012 issue of Technical Analysis of Stocks & Commodities magazine. All rights reserved. © Copyright 2012, Technical Analysis, Inc.
Return to Contents
