TRADING FOREX
The Trader’s Bread And Butter
Volume And Divergence
by Gail Mercer
Here’s how you can use a divergence between price and volume for trading forex futures or exchange traded funds.
The first time I looked at volume on my charts, I thought there had to be something significant in those bars, but I just could not put my finger on what it was. So to find out, I read books, went to seminars, attended online webinars, and studied all the cutting-edge techniques: the low-volume bars, the high-volume bars, the ultra high-volume bars, the signs of weakness, and the signs of strength. Yet on the live edge of the market, the concepts eluded me.
Instead of trading, I found myself frozen with fear of pulling the trigger because I did not know if there were hidden buyers or sellers behind the bar.
Know your buyers and sellers
After years of frustration I simply took volume off my charts altogether, realizing I might not ever be able to read those little sticks as others could. In lieu of volume, I opted to simply focus on price with my analysis premise defined around price making higher highs and lows, or lower lows and highs, or in congestion (erratic highs and lows).
As I continued to analyze the markets that way, I revamped my understanding of volume to price with a simplified approach. This new method took my volume analysis to the following two questions: was the close greater than the open (buyers), or was it less than the open (sellers)? That was all I needed to know regarding volume.

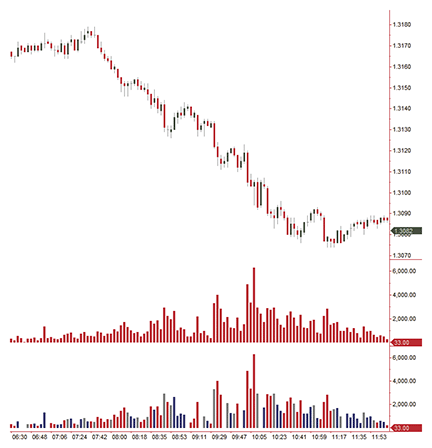
FIGURE 1: STANDARD VOLUME BARS VERSUS VOLUME ON HIGHS AND LOWS. Here you see the difference between standard volume bars and volume bars that coincide with a high or low. The blue volume bars indicate that the price bar made a high, whereas the red volume bars indicate that the price bar made a low.
Nevertheless, I still had this feeling that volume was important, so I continued to look at it on occasion. Finally, I partnered with the principals of FulcrumTraders.com who specialize in cumulative delta volume analysis (CDVA). CDVA displays what buyers and sellers are doing at a particular moment in a candlestick formation. It allows you to actually see the volume displayed just like a candlestick price chart. For the first time, this new approach made me feel as though I might be able to understand volume.
Excerpted from an article originally published in the September
2012 issue of Technical Analysis of Stocks & Commodities magazine. All rights reserved. © Copyright 2012, Technical Analysis, Inc.
Return to Contents
