TRADERS’ TIPS - SEPTEMBER 2012
Here is this month’s selection of Traders’ Tips, contributed by
various developers of technical analysis software to help readers more easily
implement some of the strategies presented in this and other issues.
Other code appearing in articles in this issue is posted in the Subscriber
Area of our website at https://technical.traders.com/sub/sublogin.asp.
Login requires your last name and subscription number (from mailing label).
Once logged in, scroll down to beneath the “Optimized trading systems” area
until you see “Code from articles.” From there, code can be copied
and pasted into the appropriate technical analysis program so that no retyping
of code is required for subscribers.
You can copy these formulas and programs for easy use in your spreadsheet
or analysis software. Simply “select” the desired text
by highlighting as you would in any word processing program, then use your
standard key command for copy or choose “copy” from the browser
menu. The copied text can then be “pasted” into any open spreadsheet
or other software by selecting an insertion point and executing a paste command.
By toggling back and forth between an application window and the open web
page, data can be transferred with ease.

For this month’s Traders’ Tips, the focus is Vladimir Vladimirovich Voznjuk’s article in this issue, “Developing A Multi-Level Strategy.” Here we present the September 2012 Traders’ Tips code.
Code for NinjaTrader 7 is already provided in Voznjuk’s article by the author, and subscribers will find this code in the Subscriber Area of our website, Traders.com. (Click on “Article Code” from our homepage.) Presented here is additional code and possible implementations for other software.

TRADESTATION: SEPTEMBER 2012
In “Developing A Multilevel Strategy” in this issue, author Vladimir Vladimirovich Voznjuk describes comparing the close minus open range for four longer time frames against a shorter time frame’s close minus open range. The code shown here makes this comparison and allows the strategy optimization engine to switch between time frames by changing the SignalData input. Optimization also allows changing trigger thresholds and trading style: channel breakouts or zero-line crosses.
To download the EasyLanguage code for the indicator, first navigate to the EasyLanguage FAQs and Reference Posts Topic in the EasyLanguage support forum (https://www.tradestation.com/Discussions/Topic.aspx?Topic_ID=47452), scroll down, and click on the link labeled “Traders’ Tips, TASC.” Then select the appropriate link for the month and year. The ELD filename is “Multi-Level.ELD.”
Multi-Level ( Indicator )

{ TASC - September 2012 }
{ Developing A Multi-Level Strategy }
{ Vladimir Vladimirovich Voznjuk }

{
Chart setup of data streams:
	Data1 = 1 minute
	Data2 = 5 minute
	Data3 = 15 minute
	Data4 = 30 minute
	Data5 = 60 minute
}

Inputs:
	SignalData( 2 {use 2,3,4,or 5}),
	BuyThreshold( -10 ),
	SellThreshold( 10 ),
	IndexFactor( 10000 ) ;
Array:
	Signals[5](0);
Variables:
	Z( 0 );

Signals[1] = Close - Open ;
Signals[2] = Close data2 - Open data2 ;
Signals[3] = Close data3 - Open data3 ;
Signals[4] = Close data4 - Open data4 ;
Signals[5] = Close data5 - Open data5 ;
Z = (Signals[1] - Signals[SignalData]) * IndexFactor;

Plot1( Z ,"Signal");
Plot2( SellThreshold,"SellTrigger");
Plot3( BuyThreshold,"BuyTrigger");
Plot4(0, "Zero" );

Multi-Level ( Strategy )

{ TASC - September 2012 }
{ Developing A Multi-Level Strategy }
{ Vladimir Vladimirovich Voznjuk }

{
Chart setup of data streams:
	Data1 = 1 minute
	Data2 = 5 minute
	Data3 = 15 minute
	Data4 = 30 minute
	Data5 = 60 minute
}

inputs:
    SignalData( 2 {use 2,3,4,or 5}),
    BuyThreshold( -10 ),
    SellThreshold( .10 ),
	IndexFactor( 10000 ),
    TradeStyle( "Channel" ) ;
arrays:
    Signals[5]( 0 ) ;
Variables:
	Z( 0 );

Signals[1] = Close - Open ;
Signals[2] = Close data2 - Open data2 ;
Signals[3] = Close data3 - Open data3 ;
Signals[4] = Close data4 - Open data4 ;
Signals[5] = Close data5 - Open data5 ;
Z = (Signals[1] - Signals[SignalData]) * IndexFactor;

if Lowerstr( TradeStyle ) = "channel" then
    begin
    if Z crosses under BuyThreshold then
        Buy next bar at market
    else if Z crosses over SellThreshold then
        SellShort next bar at market ;
    end
else
    begin
    if Z crosses over 0 then
        Buy next bar at market
    else if Z crosses under 0 then
        SellShort next bar at market ;
    end ;
A sample chart is shown in Figure 1.
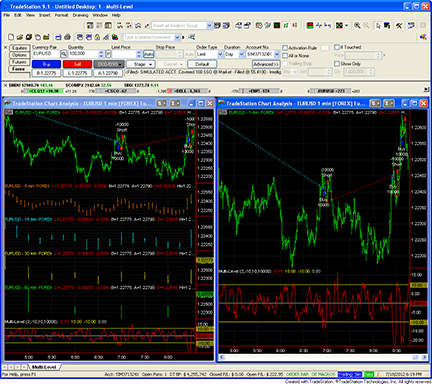
FIGURE 1: TRADESTATION, MULTI-LEVEL STRATEGY ON EUR/USD. Here are two displays of the multi-level strategy operating on charts of the EUR/USD forex pair. In both cases, there are five datastreams on the chart: 1, 5, 15, 30 and 60 minutes. The chart on the left displays all five time frames. On the right, only the one-minute data is displayed. The multi-level indicator is at the bottom of each chart, displayed as a red line.
This article is for informational purposes. No type of trading or investment recommendation, advice, or strategy is being made, given, or in any manner provided by TradeStation Securities or its affiliates.
—Mark Mills
TradeStation Securities, Inc.
A subsidiary of TradeStation Group, Inc.
www.TradeStation.com
BACK TO LIST

eSIGNAL: SEPTEMBER 2012
For this month’s Traders’ Tip, we’ve provided the formula MultiPairIndicator.efs based on Vladimir Vladimirovich Voznjuk’s article in this issue, “Developing A Multilevel Strategy.”
Our multipair indicator study presented here contains formula parameters to set the two symbols to use for the pair, an option to use the one-way pair calculation, the upper band value, lower band value, the signal method (either levels or zero line), and the buy/sell signal colors, which may be configured through the Edit Chart window. This indicator will draw up and down arrows at the top and bottom in the indicator pane based on the signals as they occur.
To discuss this study or download a complete copy of the formula code, please visit the EFS library discussion board forum under the forums link from the support menu at www.esignal.com or visit our EFS KnowledgeBase at www.esignal.com/support/kb/efs/. The eSignal formula scripts (EFS) are also available for copying & pasting below.
/*********************************
Provided By:
eSignal (Copyright c eSignal), a division of Interactive Data
Corporation. 2012. All rights reserved. This sample eSignal
Formula Script (EFS) is for educational purposes only and may be
modified and saved under a new file name.  eSignal is not responsible
for the functionality once modified.  eSignal reserves the right
to modify and overwrite this EFS file with each new release.

Description:
    Pair Trading. Developing A Multi-Level Strategy by Vladimir Vladimirovich Voznjuk

Version:            1.00  16/07/2012

Formula Symbol1eters:                         Default:
    Symbol 1                                  6J #F

    Symbol 2                                  6E #F

    One-way Pair                              false
    Lower Band                                -0.01
    Upper Band                                0.01
    Signal Method                             Levels
    Buy Color                                 blue
    Sell Color                                red


Notes:
The related article is copyrighted material. If you are not a subscriber
of Stocks & Commodities, please visit www.traders.com.

**********************************/

var fpArray = new Array();

function preMain()
{
    setStudyTitle("MultiPair Indicator");

    setIntervalsBackfill(true);

    var x = 0;


    fpArray[x] = new FunctionParameter("gSymbol1", FunctionParameter.STRING);
    with(fpArray[x++])
    {


        setName("Symbol 1");
        setDefault("6J #F");
    }


    fpArray[x] = new FunctionParameter("gSymbol2", FunctionParameter.STRING);
    with(fpArray[x++])
    {
        setName("Symbol 2");
        setDefault("6E #F");
    }


    fpArray[x] = new FunctionParameter("gOneWay", FunctionParameter.BOOLEAN);
    with(fpArray[x++])
    {
        setName("One-way Pair");
        setDefault(false);
    }

    fpArray[x] = new FunctionParameter("gLower", FunctionParameter.NUMBER);
    with(fpArray[x++])
    {
        setName("Lower Band");
        setDefault(-0.01);
    }


    fpArray[x] = new FunctionParameter("gUpper", FunctionParameter.NUMBER);
    with(fpArray[x++])
    {
        setName("Upper Band");
        setDefault(0.01);
    }

    fpArray[x] = new FunctionParameter("gMethod", FunctionParameter.STRING);
    with(fpArray[x++])
    {
        setName("Signal Method");

        addOption("Levels");

        addOption("Zero line");
        setDefault("Levels");
    }


    fpArray[x] = new FunctionParameter("gBuyColor", FunctionParameter.COLOR);
    with(fpArray[x++])
    {
        setName("Buy Color");
        setDefault(Color.blue);
    }


    fpArray[x] = new FunctionParameter("gSellColor", FunctionParameter.COLOR);
    with(fpArray[x++])
    {
        setName("Sell Color");
        setDefault(Color.red);
    }
}

var bInit = false;
var bVersion = null;


var xSymbol2Open = null;

var xSymbol2Close = null;


var xSymbol1Open = null;

var xSymbol1Close = null;


var vInterval = null;


function main(gSymbol1, gSymbol2, gOneWay, gLower, gUpper, gMethod,gBuyColor,gSellColor)
{
    if (bVersion == null) bVersion = verify();
    if (bVersion == false) return;

    if (!bInit)
    {

        vInterval = getInterval();
        xSymbol2Open = open(sym(gSymbol2+","+vInterval));

        xSymbol2Close = close(sym(gSymbol2+","+vInterval));


        xSymbol1Open = open(sym(gSymbol1+","+vInterval));

        xSymbol1Close = close(sym(gSymbol1+","+vInterval));


        addBand(gLower,PS_SOLID,1,gBuyColor,0);

        addBand(gUpper,PS_SOLID,1,gSellColor,1);

        addBand(0,PS_SOLID,1,Color.lime,2);


        bInit = true;
    }

    var vSymbol2Open_0 = xSymbol2Open.getValue(0);

    var vSymbol2Open_1 = xSymbol2Open.getValue(-1);


    var vSymbol2Close_0 = xSymbol2Close.getValue(0);

    var vSymbol2Close_1 = xSymbol2Close.getValue(-1);


    var vSymbol1Open_0 = xSymbol1Open.getValue(0);

    var vSymbol1Open_1 = xSymbol1Open.getValue(-1);


    var vSymbol1Close_0 = xSymbol1Close.getValue(0);

    var vSymbol1Close_1 = xSymbol1Close.getValue(-1);

    if (vSymbol2Open_1 == null || vSymbol2Close_1 == null || vSymbol1Open_1 == null || vSymbol1Close_1 == null)
        return;


    var vRes_0 = 0;

    var vRes_1 = 0;


    if (gOneWay)

    {

        vRes_0 = (vSymbol2Close_0 - vSymbol2Open_0)+(vSymbol1Close_0 - vSymbol1Open_0);

        vRes_1 = (vSymbol2Close_1 - vSymbol2Open_1)+(vSymbol1Close_1 - vSymbol1Open_1);

    }

    else

    {

        vRes_0 = (vSymbol2Close_0 - vSymbol2Open_0)-(vSymbol1Close_0 - vSymbol1Open_0);

        vRes_1 = (vSymbol2Close_1 - vSymbol2Open_1)-(vSymbol1Close_1 - vSymbol1Open_1);

    }


    var nBarsCount = getCurrentBarCount();


    if (gMethod == "Levels")

    {
        if (vRes_0>gUpper && vRes_1<gUpper)
        {
            drawShapeRelative(0, TopRow2  , Shape.DOWNARROW, null, gSellColor, Shape.PRESET,"LDn"+nBarsCount);
        }

        else

        {

            removeShape("LDn"+nBarsCount);

        }

        if (vRes_0<gLower && vRes_1>gLower)
        {
            drawShapeRelative(0, BottomRow2  , Shape.UPARROW, null, gBuyColor, Shape.PRESET,"LUp"+nBarsCount);
        }

        else

        {

            removeShape("LUp"+nBarsCount);

        }

    }


    if (gMethod == "Zero line")

    {
        if (vRes_1<0 && vRes_0>0)
        {

            drawShapeRelative(0, BottomRow2  , Shape.UPARROW, null, gBuyColor, Shape.PRESET,"ZUp"+nBarsCount);
        }

        else

        {

            removeShape("ZUp"+nBarsCount);

        }

        if (vRes_1>0 && vRes_0<0)
        {
            drawShapeRelative(0, TopRow2  , Shape.DOWNARROW, null, gSellColor, Shape.PRESET,"ZDn"+nBarsCount);
        }

        else

        {

            removeShape("ZDn"+nBarsCount);

        }

    }

    return vRes_0;
}

function verify() {
    var b = false;
    if (getBuildNumber() < 779) {
        drawTextAbsolute(5, 35, "This study requires version 8.0 or later.",
            Color.white, Color.blue, Text.RELATIVETOBOTTOM|Text.RELATIVETOLEFT|Text.BOLD|Text.LEFT,
            null, 13, "error");
        drawTextAbsolute(5, 20, "Click HERE to upgrade.@URL=https://www.esignal.com/download/default.asp",
            Color.white, Color.blue, Text.RELATIVETOBOTTOM|Text.RELATIVETOLEFT|Text.BOLD|Text.LEFT,
            null, 13, "upgrade");
        return b;
    } else {
        b = true;
    }
    return b;
}
A sample chart is shown in Figure 2.
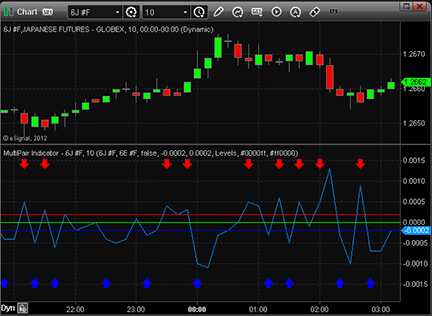
FIGURE 2: eSIGNAL, MULTIPAIR INDICATOR STUDY
—Jason Keck
eSignal, an Interactive Data company
800 779-6555, www.eSignal.com
BACK TO LIST

WEALTH-LAB: SEPTEMBER 2012
This Traders’ Tip is based on “Developing A Multilevel Strategy” by Vladimir Vladimirovich Voznjuk in this issue.
In his article, Voznjuk shows how a simple currency pair-trading technique can be applied on any intraday time frame. The indicator, however, does not come with universal or fixed thresholds. It’s up to the trader to find the optimal thresholds on a by-currency basis after optimization. (See Figure 3.)
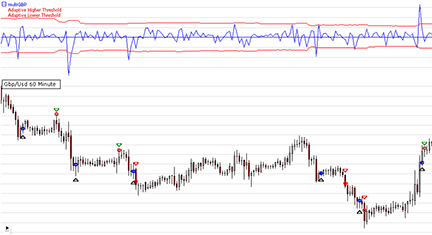
FIGURE 3: WEALTH-LAB. This 60-minute GBPUSD chart illustrates the application of the multiGBP indicator and the adaptive thresholds.
To overcome this, you can use this simple technique (or a similar one): apply a Bollinger Band with a sufficiently long-term period to the multilevel indicator. For example, a 100-period BB with two standard deviations might work well. In addition, these boundaries adjust to the volatility of the instruments and can save you from frequent reoptimization.
As the multilevel indicators depend on the name of the currencies, we’re not including them in the TASCIndicators library. Instead, we’re providing this sample C# strategy code to serve as a guideline for building it yourself — which is an easy task due to the low complexity of the formula.
C# Code:

using System;
using System.Collections.Generic;
using System.Text;
using System.Drawing;
using WealthLab;
using WealthLab.Indicators;

namespace WealthLab.Strategies
{
	public class MultiLevel : WealthScript
	{
		private StrategyParameter paramStop;
		private StrategyParameter paramTake;

		public MultiLevel()
		{
			paramStop = CreateParameter("Stop, pips", 20, 5, 50, 5);
			paramTake = CreateParameter("Profit, pips", 30, 5, 100, 5);
		}

		protected override void Execute()
		{
			try
			{
				Bars bEur = GetExternalSymbol( "Eur/Usd", true );
				Bars bGbp = GetExternalSymbol( "Gbp/Usd", true );
				DataSeries multiGBP =
				(bEur.Close-bEur.Open) + (bGbp.Close+bGbp.Open) / 10000;
				multiGBP.Description = "multiGBP";
				BBandLower bbl = BBandLower.Series( multiGBP, 100, 2.0 );
				BBandUpper bbu = BBandUpper.Series( multiGBP, 100, 2.0 );
				bbl.Description = "Adaptive Lower Threshold";
				bbu.Description = "Adaptive Higher Threshold";

				ChartPane cp = CreatePane( 50,true,true );
				PlotSeries( cp, multiGBP, Color.Blue, LineStyle.Solid, 1 );
				PlotSeriesFillBand( cp, bbu, bbl, Color.Red,
					Color.Transparent, LineStyle.Solid, 1 );
				DrawHorzLine( cp, 0, Color.Blue, LineStyle.Solid, 1 );
				HideVolume();

				double SL = paramStop.Value / 10000d;
				double PT = paramTake.Value / 10000d;

				for(int bar = GetTradingLoopStartBar( 100 );
bar < Bars.Count; bar++)
				{
					if (IsLastPositionActive)
					{
						Position p = LastPosition;

						double Stop =
p.PositionType == PositionType.Long ? 					p.EntryPrice - SL : p.EntryPrice + SL;
						double Target =
p.PositionType == PositionType.Long ? 					p.EntryPrice + PT : p.EntryPrice - PT;

						if( !ExitAtStop(bar + 1, p, Stop, "SL") )
							ExitAtLimit(bar + 1, p, Target, "TP");
					}
					else
					{
						if( CrossOver( bar, multiGBP, bbl ) )
							BuyAtMarket( bar+1 );
						else
							if( CrossUnder( bar, multiGBP, bbu ) )
								ShortAtMarket( bar+1 );
					}
				}
			}
			catch( Exception e )
			{
				PrintDebug( e.Message );
				Abort();
			}
		}
	}
}
—Wealth-Lab team
MS123 LLC
www.wealth-lab.com
BACK TO LIST

AMIBROKER: SEPTEMBER 2012
In “Developing A Multilevel Strategy” by Vladimir Vladimirovich Voznjuk in this issue, the author presents a simple indicator for currency pair trading.
A ready-to-use formula for the article implementing multiCHF is presented in the listing here. To use it, enter the formula in the AFL Editor, then press Insert Indicator.
You should modify the ticker symbol to match your data vendor symbology. You may need to adjust the scale if you apply this indicator to different pairs than EUR/USD and USD/CHF.
A sample chart is shown in Figure 4.
Ticker = "USDCHF.FXCM"; // the 'other' currency pair
SetForeign(Ticker);
fc = Close;
fo = Open;
RestorePriceArrays();
scale = 1; // scale depending on relationship of currency pairs
z = ( Close - Open ) - (fc - fo ) * scale;
Plot( z, "multi" + Ticker, colorRed );
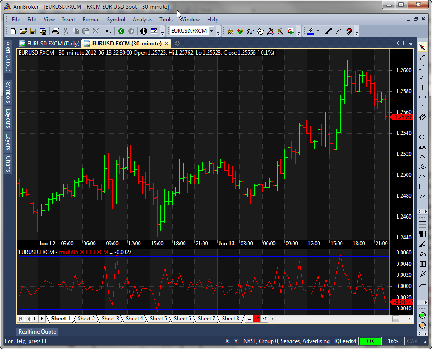
FIGURE 4: AMIBROKER. Here is a 30-minute EUR/USD price (upper pane) with the 30-minute multiCHF indicator.
—Tomasz Janeczko, AmiBroker.com
www.amibroker.com
BACK TO LIST

NEUROSHELL TRADER: SEPTEMBER 2012
Multi-instrument strategies such as those described by Vladimir Vladimirovich Voznjuk in his article in this issue, “Developing A Multi-Level Strategy,” can be easily implemented in NeuroShell Trader.
First, create a new chart with a different chart page for each instrument in the pair or group of instruments in which you want to synchronize trading. For instance, to synchronize trading of EUR/USD and USD/JPY, a new chart would be created with EUR/USD and USD/JPY as the two chart pages. To synchronize trading of three or more instruments like EUR/USD, GBP/USD, and EUR/GBP, simply create a new chart with the desired three or more instruments, each as a separate chart page.
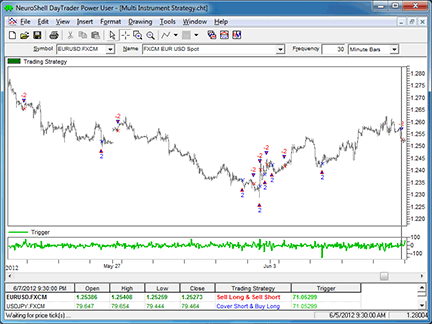
FIGURE 5: NEUROSHELL TRADER. This NeuroShell Trader chart shows a multi-currency trading system.
To create the trigger indicator for opening and closing positions, select “New Indicator” from the Insert menu, use the Indicator Wizard to create one of the following and select “Other instrument data” to choose the instruments as indicator parameters.
TRIGGER
(for two instruments moving in the same direction such as EUR/USD and GBP/USD):
Multiply2( Add( Subtract( EUR/USD Close, EUR/USD Open ), Subtract( GBP/USD Close, GBP/USD Open) ), 10000 )
TRIGGER
(for two instruments moving in different directions such as EUR/USD and USD/JPY):
Multiply2( Subtract( Subtract( EUR/USD Close, EUR/USD Open ), Subtract( USD/JPY Close, USD/JPY Open) ), 10000 )
To create a threshold-based or crossover-based trading system for trading a pair or a group of instruments moving in the same direction, select “New Trading Strategy” from the Insert menu and enter one of the following formulas in the appropriate locations of the Trading Strategy Wizard:
THRESHOLD SYSTEM
Generate a buy long market order if all of the following are true:
A>B( TRIGGER, 100)
Generate a sell short market order if all of the following are true:
A<B( TRIGGER, -100)
CROSSOVER SYSTEM
Generate a buy long market order if all of the following are true:
CrossAbove( TRIGGER, 0)
Generate a sell short market order if all of the following are true:
CrossBelow( TRIGGER, 0)
To create a trading system for trading a pair or group of instruments in different directions, simply create different entry conditions for each chart page, as shown in Figure 5. Each entry condition shown combines both the threshold or crossover condition for each instrument and a condition that compares the chart page’s close history to the other instrument data close history to identify which instrument’s chart page is being fired. Trading in opposite directions is accomplished by putting the same threshold or crossover condition (for instance, trigger > 100) in the opposite buy long or sell short condition list for each instrument.
THRESHOLD SYSTEM
Generate a buy long market order if ONE of the following is true:
AND2( A>B(TRIGGER,100), A=B(Sum(Close,10), Sum(Instrument1 Close,10) ) )
AND2( A<B(TRIGGER,-100), A=B(Sum(Close,10), Sum(Instrument2 Close,10) ) )
Generate a sell short market order if ONE of the following is true:
AND2( A<B(TRIGGER,-100), A=B(Sum(Close,10), Sum(Instrument1 Close,10) ) )
AND2( A>B(TRIGGER,100), A=B(Sum(Close,10), Sum(Instrument2 Close,10) ) )
CROSSOVER SYSTEM
Generate a buy long market order if ONE of the following is true:
AND2( CrossAbove(TRIGGER,0), A=B(Sum(Close,10), Sum(Instrument1 Close,10) ) )
AND2( CrossBelow(TRIGGER,0), A=B(Sum(Close,10), Sum(Instrument2 Close,10) ) )
Generate a sell short market order if ONE of the following is true:
AND2( CrossBelow(TRIGGER,0), A=B(Sum(Close,10), Sum(Instrument1 Close,10) ) )
AND2( CrossAbove(TRIGGER,0), A=B(Sum(Close,10), Sum(Instrument2 Close,10) ) )
If you have NeuroShell Trader Professional, you can also choose whether the parameters such as the trigger threshold should be optimized. After backtesting the trading strategy, use the “Detailed Analysis” button to view the backtest and trade-by-trade statistics for the strategy.
Users of NeuroShell Trader can go to the Stocks & Commodities section of the NeuroShell Trader free technical support website to download a copy of this or any past Traders’ Tips.
—Marge Sherald
Ward Systems Group, Inc.
301 662-7950
sales@wardsystems.com
www.neuroshell.com
BACK TO LIST

AIQ: SEPTEMBER 2012
The AIQ code for Vladimir Vladimirovich Voznjuk’s article in this issue, “Developing A Multilevel Strategy,” is provided at www.TradersEdgeSystems.com/traderstips.htm, and is shown below.
Although AIQ software can chart and test forex data, testing stocks is more interesting. Using the author’s concept of trading using multiple instruments to generate signals, I designed a system that uses both the group index for a stock and the SPX. The multi-instrument indicator that I designed uses the 20-day rate of change in price for the stock and its related group, which is then smoothed by a simple average over 20 days. I then take a ratio of the stock’s smoothed rate of change to its related group’s smoothed rate of change. Finally, I take a stochastic of this ratio (“StoMSG”). The system goes long when the stock, group, and SPX index are in uptrends as measured by the direction of their 50-day simple moving average (higher than it was 10 days ago) and in addition, for the stock and group, the 20-day rate of change is greater than zero. Buy when the trend is up (as defined here) and the StoMSG is less than or equal to 10. Exit longs when one of the following is met: the position has been held for 20 days, or the StoMSG is greater than or equal to 90, or the simple average of the SPX close is less than its value 10 days ago.
To test the multimarket group stock system using the Portfolio Manager for the period 1/1/1999 to 7/18/2012, a trading simulation was run with the following capitalization settings:
- Maximum of 10 open positions
- Size each position at 10% of mark-to-market total capital
- Take no more than 10 new positions per day
- Compute the mark-to-market capital each day
- Choose signals based on a relative strength indicator for ranking in descending order for longs (long-only system)
In Figure 6, I show the resulting statistics and equity curve compared to the SPX. The test was run using the S&P 500 group/section structure that can be downloaded from the AIQ website for the period 1/1/1999 to 7/18/2012. AIQ allows for the creation of custom group and sector structures and also has two structures, the S&P 500 and the AIQALL. The S&P 500 groups contain just the stocks in the S&P 500, while the AIQALL groups have most of the stocks that can be traded.
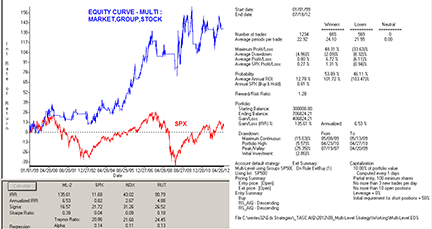
FIGURE 6: AIQ, MULTI-INSTRUMENT TEST SYSTEM. Here is an equity curve for my test system that uses the multi-instrument concept for the period 1/1/1999 to 7/18/2012. The S&P 500 group/sector structure was used for the secondary instruments and the S&P 500 stocks were traded.
!DEVELOPING A MULTI-LEVEL STRATEGY
!Author: Vladimir Voznjuk, TASC Sept 2012
!Coded by: Richard Denning 7/16/2012
!www.TradersEdgeSystems.com

! ABBREVIATIONS:
C 	 is [close].
Cx	 is valresult(C,20).
O 	 is [open].
avgV	 is simpleavg([volume],50).
PEP 	 is {position entry price}.
PD 	 is {position days}.
Name	 is description().
Group	 is tickerUDF(rsTicker(),name).
GrpSym 	 is tickerUDF(rsTicker(),symbol()).
GrpO	 is tickerUDF(rsTicker(),O).
GrpC 	 is tickerUDF(rsTicker(),C).
GrpCx 	 is valresult(GrpC,20).

!UDFs FOR INDICATOR & SYSTEM:
StkCOPct is simpleavg((C - Cx ) / Cx * 100,20).
GrpCOPct is simpleavg((GrpC - GrpCx) / GrpCx * 100,20).
MA50 	 is simpleavg(C,50).
GrpMA50  is simpleavg(GrpC,50).
SPXma50  is tickerUDF("SPX",MA50).
MSG 	 is StkCOPct / GrpCOPct.

!PLOT THE FOLLOWING WITH 90 & 10 LINES:
StoMSG is (MSG - lowresult(MSG,60)) /
	(highresult(MSG,60) - lowresult(MSG,60)) * 100.

!REPORT TO LIST VALUES FOR A SINGLE DAY:
ShowValues if StkCOPct > 0
	and MA50 > valresult(MA50,10)
	and GrpCOPct > 0
	and GrpMA50 > valresult(GrpMA50,10)
	and C > 10 and avgV > 3000.

!TRADING SYSTEM RULES:
Buy if StoMSG <= 10
	and StkCOPct > 0
	and MA50 > valresult(MA50,10)
	and GrpCOPct > 0
	and GrpMA50 > valresult(GrpMA50,10)
	and C > 0 and avgV > 3000
	and SPXma50 > valresult(SPXma50,10).
ExitBuy if StoMSG >= 90
	or PD >= 20
	or SPXma50 < valresult(SPXma50,10).

!FOR RANKING SIGNALS FOR TRADING SIMULATION
!  IN PORTFOLIO MANAGER:
!AIQ RELATIVE STRENGTH:
Price1	is C.
Price2	is O.
MTL 	is 30.
Q3m 	is MTL / 4.
Q2m	is (MTL - Q3m) / 3.
Q1m	is (MTL - Q2m - Q3m) / 2.
Q0m	is MTL - Q1m - Q2m - Q3m.
ROCq3m 	is (valresult(price1,Q2m,(Q1m+Q0m)) /
 	valresult(price2,Q3m,(Q2m+Q1m+Q0m)) - 1) * 100.
ROCq2m	is (valresult(price1,Q1m,Q0m) /
	valresult(price2,Q2m,(Q1m+Q0m)) - 1) * 100.
ROCq1m	is (valresult(price1,Q0m,0)  /
	valresult(price2,Q1m,Q0m) -1 ) * 100.
ROCq0m	is (price1 / valresult(price2,Q0m,0) - 1) * 100.
RS_AIQ	is ROCq0m * 0.40 + ROCq1m * 0.20
	+ ROCq2m * 0.20 + ROCq3m * 0.20.
—Richard Denning
info@TradersEdgeSystems.com
for AIQ Systems
BACK TO LIST

TRADERSSTUDIO: SEPTEMBER 2012
The TradersStudio code based on Vladimir Vladimirovich Voznjuk’s article, “Developing A Multilevel Strategy” is provided at the following websites (and is also shown below):
The following code files are provided in the download:
- Function: “multiRangeDiff” for computing the author’s multilevel indicator values
- System: “MULTI_JPY,” a system for trading the USD/JPY using EUR/USD as secondary datastream
- Indicator plot: “MULTI_JPY_IND,” an indicator for plotting the multilevel indicator for the USDJPY/EURUSD
- System: “MULTI_EUR,” a system for trading the EUR/USD using USD/JPY as secondary datastream
- Indicator plot: “MULTI_EUR_IND,” an indicator for plotting the multilevel indicator for the EURUSD/USDJPY
I added an exit to the author’s suggested trading system that uses the multilevel indicator to exit. I then optimized the four parameters of the system and ran the backtest on both of the systems. The equity and underwater curves are shown in Figures 7 and 8. I used daily forex data from Pinnacle Data Systems for the tests. TradersStudio software is particularly well-suited for testing forex since it takes into account both the leverage of the account and the interest earned and charged on the overnight positions. In the backtest of the USD/JPY, there was net interest paid of $2,307 ($5,490 earned on the longs, $7,797 paid on the shorts). In the backtest of the EUR/USD, there was net interest $6,072 ($5,583 earned on the longs, $489 earned on the shorts). Both tests were run over the period 2/2/2001 to 7/13/2012 with leverage set to 25.
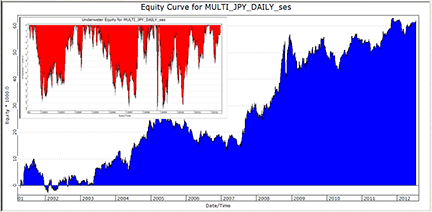
FIGURE 7: TRADERSSTUDIO, USD/JPY. Here are equity and underwater curves for optimized combination trading USD/JPY from 2001 to 2012.
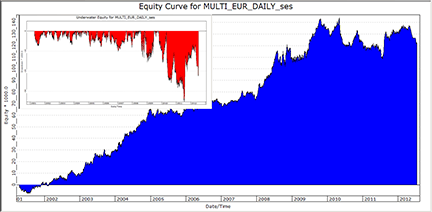
FIGURE 8: TRADERSSTUDIO, EUR/USD. Here are equity and underwater curves for optimized combination trading EUR/USD from 2001 to 2012.
'DEVELOPING A MULTI-LEVEL STRATEGY
'Author: Vladimir Voznjuk, TASC Sept 2012
'Coded by: Richard Denning 7/16/2012
'www.TradersEdgeSystems.com

Function multiRangeDiff(momRange,indRange,sameDirection,scalingFactor,applyToMomSeries)
If applyToMomSeries = False Then
    If sameDirection = True Then
        multiRangeDiff = momRange + indRange*scalingFactor
    Else
        multiRangeDiff = momRange - indRange*scalingFactor
    End If
Else
    If sameDirection = True Then
        multiRangeDiff = momRange*scalingFactor + indRange
    Else
        multiRangeDiff = momRange*scalingFactor - indRange
    End If
End If
End Function
'-----------------------------------------------------------
Sub MULTI_JPY(scalingFactor,HighV,LowV,ExitLvl)
'defaults: scalingFactor=20,HighV=0,LowV=-0.8,ExitLvl=0
'mom series = USDJPY
'independent1 series = EURUSD
Dim momRange As BarArray
Dim indRange As BarArray
Dim multiRange As BarArray
Dim EURUSD_C As BarArray
Dim EURUSD_O As BarArray
EURUSD_C = C Of independent1
EURUSD_O = O Of independent1
momRange = C - O
indRange = EURUSD_C - EURUSD_O
'multiRangeDiff(momRange,indRange,sameDirection,scalingFactor,applyToMomSeries)
multiRange = multiRangeDiff(momRange,indRange,False,scalingFactor,False)
If multiRange > HighV Then Sell("SE",1,0,Market,Day)
If multiRange < ExitLvl Then ExitShort("SX","",1,0,Market,Day)
If multiRange < LowV Then Buy("LE",1,0,Market,Day)
If multiRange > ExitLvl Then ExitLong("LX","",1,0,Market,Day)
End Sub
'------------------------------------------------------------
Sub MULTI_JPY_IND(scalingFactor,upper,lower)
'defaults: scalingFactor=20,upper=0,lower=-0.8
'mom series = USDJPY
'independent1 series = EURUSD
Dim momRange As BarArray
Dim indRange As BarArray
Dim multiRange As BarArray
Dim EURUSD_C As BarArray
Dim EURUSD_O As BarArray
EURUSD_C = C Of independent1
EURUSD_O = O Of independent1
momRange = C - O
indRange = EURUSD_C - EURUSD_O
multiRange = multiRangeDiff(momRange,indRange,False,scalingFactor,False)

plot1(multiRange)
plot2(upper)
plot3(lower)
End Sub
'-------------------------------------------------------------
Sub MULTI_EUR(scalingFactor,HighV,LowV,ExitLvl)
'defaults: scalingFactor=50,HighV=0.3,LowV=0,ExitLvl=0.7
'mom series = EURUSD
'independent1 series = USDJPY
Dim momRange As BarArray
Dim indRange As BarArray
Dim multiRange As BarArray
Dim USDJPY_C As BarArray
Dim USDJPY_O As BarArray
USDJPY_C = C Of independent1
USDJPY_O = O Of independent1
momRange = C - O
indRange = USDJPY_C - USDJPY_O
'multiRangeDiff(momRange,indRange,sameDirection,scalingFactor,applyToMomSeries)
multiRange = multiRangeDiff(momRange,indRange,False,scalingFactor,True)
If multiRange > HighV Then Sell("SE",1,0,Market,Day)
If multiRange < ExitLvl Then ExitShort("SX","",1,0,Market,Day)
If multiRange < LowV Then Buy("LE",1,0,Market,Day)
If multiRange > ExitLvl Then ExitLong("LX","",1,0,Market,Day)
End Sub
'-------------------------------------------------------------
Sub MULTI_EUR_IND(scalingFactor,upper,lower)
'defaults: scalingFactor=50,upper=0.3,lower=0
'mom series = EURUSD
'independent1 series = USDJPY
Dim momRange As BarArray
Dim indRange As BarArray
Dim multiRange As BarArray
Dim USDJPY_C As BarArray
Dim USDJPY_O As BarArray
USDJPY_C = C Of independent1
USDJPY_O = O Of independent1
momRange = C - O
indRange = USDJPY_C - USDJPY_O
multiRange = multiRangeDiff(momRange,indRange,False,scalingFactor,True)
plot1(multiRange)
plot2(upper)
plot3(lower)
End Sub
'--------------------------------------------------------------
—Richard Denning
info@TradersEdgeSystems.com
for TradersStudio
BACK TO LIST

UPDATA: SEPTEMBER 2012
This tip is based on “Developing A Multilevel Strategy” by Vladimir Vladimirovich Voznjuk in this issue.
In his article, the author proposes an automated approach to trading currency pairs based principally around the oscillation of a currency pair with its own futures product or other exchange rates. The version of the system we are giving is for the Swiss franc/dollar spot rate 6S future (USD/CHF), entering reversal trades at oscillator extremes. The zero crossing version can be replicated by setting the entry parameters to zero.
The Updata code for this article is in the Updata Library and may be downloaded by clicking the Custom menu and System Library. Those who cannot access the library due to a firewall may paste the code shown here into the Updata custom editor and save it.
A sample chart is shown in Figure 9.
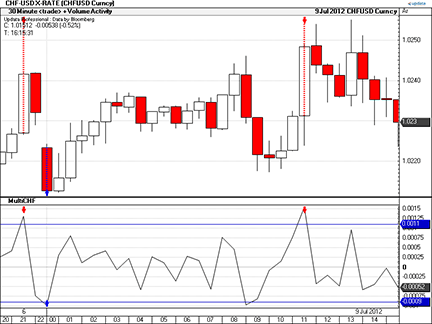
FIGURE 9: UPDATA. This chart shows the Swiss franc/US dollar (CHF/USD) 30-minute exchange rate with the spot-future oscillator in the lower pane.
'Developing a MultiLevel Strategy
PARAMETER "CHFUSD Ticker" ~CHFUSD=Select
PARAMETER "6S Future" ~6SFUTURE=Select
PARAMETER "Upper Extrema" @UpperExtrema=0.0011
PARAMETER "Lower Extrema" @LowerExtrema=-0.00095
NAME "MultiCHF" ""
DISPLAYSTYLE 3LINES
INDICATORTYPE CHART
INDICATORTYPE2 TOOL
PLOTSTYLE2 LINE RGB(0,0,200)
PLOTSTYLE3 LINE RGB(0,0,200)
@MultiCHF=0

FOR #CURDATE=0 TO #LASTDATE
   'MultiCHF Calculation
   @MultiCHF=(CLOSE(~CHFUSD,0)-OPEN(~CHFUSD,0))-(CLOSE(~6SFUTURE,0)-OPEN(~6SFUTURE,0))/1000
   'Entry & Exits
   If HasX(@MultiCHF,@UpperExtrema,UP)
      Sell Close
      Short Close
   ElseIf HasX(@MultiCHF,@LowerExtrema,DOWN)
      Cover Close
      Buy Close
   EndIf
   'Plots
   @PLOT=@MultiCHF
   @PLOT2=@UpperExtrema
   @PLOT3=@LowerExtrema
NEXT
—Updata support team
support@updata.co.uk
www.updata.co.uk
BACK TO LIST

THINKORSWIM: SEPTEMBER 2012
In “Developing A Multilevel Strategy” in this issue, author Vladimir Vladimirovich Voznjuk gives us a study and strategy that are designed to be used when trading two or three currency pairs simultaneously.
When trading two pairs that move in the same direction, you are looking for entries and exits when the pairs have correlated moves. When trading pairs that move in different directions, you need to look for entries and exits when the pairs are moving away from each other. Voznjuk’s study creates a histogram displaying the intensity of these moves for the chosen currencies.
For thinkorswim users, we have created a study and a strategy in our proprietary scripting language, thinkScript. The study is not going to be affected by the charted symbol but rather by the prices of the currency futures selected in the settings. Once the thinkorswim strategy has been added to your chart (Figure 10), you can right-click on the name of the strategy on the price graph and choose “show report.” This will allow you to see how the strategy has performed over the charted time frame. Adjust the parameters of the strategy within the Edit Studies window to fine tune your entry and exits points.
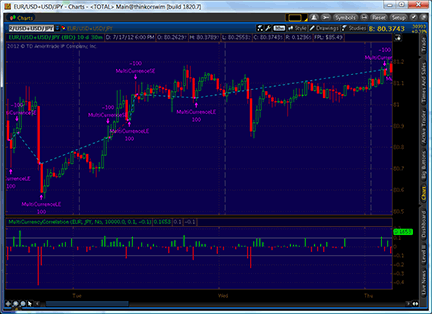
FIGURE 10: THINKORSWIM
Thinkorswim Study:
- From our TOS Charts, Select “Studies” → “Edit Studies”.
- Select the “Studies” tab in the upper left hand corner.
- Select “New” in the lower left hand corner.
- Name the Oscillator study (i.e. MultiCurrencyCorrelation)
- Click in the script editor window, remove “plot data = close” and paste the following:
script getPrice {
    input price = FundamentalType.CLOSE;
    input currency = {default "EUR", "GBP", "JPY", "CAD", "CHF", "NZD", "AUD"};
    plot SecondaryPrice;
    switch (currency) {
    case "EUR":
        SecondaryPrice = fundamental(price, "/6E");
    case "GBP":
        SecondaryPrice = fundamental(price, "/6B");
    case "JPY":
        SecondaryPrice = fundamental(price, "/6J");
    case "CAD":
        SecondaryPrice = fundamental(price, "/6C");
    case "CHF":
        SecondaryPrice = fundamental(price, "/6S");
    case "NZD":
        SecondaryPrice = fundamental(price, "/6N");
    case "AUD":
        SecondaryPrice = fundamental(price, "/6A");
    }
}

declare lower;

input firstCurrency = {default "EUR", "GBP", "JPY", "CAD", "CHF", "NZD", "AUD"};
input secondCurrency =  {"EUR", "GBP", default "JPY", "CAD", "CHF", "NZD", "AUD"};
input areOneWayPairs = no;
input multiplier = 10000.0;
input upperLimit = 0.1;
input lowerLimit = -0.1;

def firstClose = getPrice(FundamentalType.CLOSE, firstCurrency);
def firstOpen = getPrice(FundamentalType.OPEN, firstCurrency);
def secondClose = getPrice(FundamentalType.CLOSE, secondCurrency);
def secondOpen = getPrice(FundamentalType.OPEN, secondCurrency);

plot Corr = (firstClose - firstOpen) + (secondClose - secondOpen) * multiplier * if areOneWayPairs then 1 else -1;
plot Upper = upperLimit;
plot Lower = lowerLimit;

Corr.SetPaintingStrategy(PaintingStrategy.HISTOGRAM);
Corr.SetLineWeight(3);
Corr.DefineColor("Positive", Color.UPTICK);
Corr.DefineColor("Negative", Color.DOWNTICK);
Corr.AssignValueColor(if Corr >= 0 then Corr.color("Positive") else Corr.color("Negative"));
Upper.SetDefaultColor(Color.GRAY);
Lower.SetDefaultColor(Color.GRAY);
Thinkorswim Strategy:
- From our TOS Charts, Select “Studies” → “Edit Studies”.
- Select the “Strategies” tab in the upper left hand corner.
- Select “New” in the lower left hand corner.
- Name the Oscillator study (i.e. MultiCurrencySTRATEGY)
- Click in the script editor window, remove “plot data = close” and paste the following:
script getPrice {
    input price = FundamentalType.CLOSE;
    input currency = {default "EUR", "GBP", "JPY", "CAD", "CHF", "NZD", "AUD"};
    plot SecondaryPrice;
    switch (currency) {
    case "EUR":
        SecondaryPrice = fundamental(price, "/6E");
    case "GBP":
        SecondaryPrice = fundamental(price, "/6B");
    case "JPY":
        SecondaryPrice = fundamental(price, "/6J");
    case "CAD":
        SecondaryPrice = fundamental(price, "/6C");
    case "CHF":
        SecondaryPrice = fundamental(price, "/6S");
    case "NZD":
        SecondaryPrice = fundamental(price, "/6N");
    case "AUD":
        SecondaryPrice = fundamental(price, "/6A");
    }
}


input firstCurrency = {default "EUR", "GBP", "JPY", "CAD", "CHF", "NZD", "AUD"};
input secondCurrency =  {"EUR", "GBP", default "JPY", "CAD", "CHF", "NZD", "AUD"};
input areOneWayPairs = no;
input multiplier = 10000.0;
input upperLimit = 0.1;
input lowerLimit = -0.1;

def firstClose = getPrice(FundamentalType.CLOSE, firstCurrency);
def firstOpen = getPrice(FundamentalType.OPEN, firstCurrency);
def secondClose = getPrice(FundamentalType.CLOSE, secondCurrency);
def secondOpen = getPrice(FundamentalType.OPEN, secondCurrency);
def Corr = (firstClose - firstOpen) + (secondClose - secondOpen) * multiplier * if areOneWayPairs then 1 else -1;

addOrder(OrderType.BUY_AUTO, Corr < lowerLimit, name = "MultiCurrenceLE");
addOrder(OrderType.SELL_AUTO, Corr > upperLimit, name = "MultiCurrenceSE");
—thinkorswim
A division of TD Ameritrade, Inc.
www.thinkorswim.com
BACK TO LIST
Originally published in the September 2012 issue of
Technical Analysis of Stocks & Commodities magazine.
All rights reserved. © Copyright 2012, Technical Analysis, Inc.
Return to
Contents


