INDICATORS
Halloween With A Twist
A Seasonal Strategy With Leveraged ETFs
by Gerald Gardner
The Halloween indicator, also known as “Sell in May and go away,” is a well-known seasonal strategy that investors apply to the financial markets. But it comes with its share of risk. Here is how you can use this seasonal strategy with a twist using leveraged exchange traded funds.
A well-known anomaly in stock market
timing is the Halloween indicator. It is possible to produce a 20% annual return
with a modest 12% drawdown using this indicator combined with a simple moving
average and a commodity fund. The risk is also half of that of a buy & hold
strategy due to the brevity of the investment, which usually runs about six
months.
Halloween indicator
The Halloween indicator is a famous anomaly in stock market cycles. A problem with using anomalies in the real world is that they can quit working at any time. For the anomaly to be useful, it must persist and continue despite its well-publicized results.
The Halloween anomaly has been analyzed since 1964. Emerging markets and other shorter time series have been studied since 1969. One study testing the Halloween indicator in US equity markets over a 21-year period (April 1982 to April 2003) using futures data verified the presence of a significant effect. The findings led researchers to conclude that the indicator was an “exploitable anomaly” in the US during that time period. That these studies have been published and yet the anomaly persists is a good sign that it will continue.
The exploitation of the Halloween indicator is a simple and effective strategy. The stocks are purchased on October 1 then retained until May 1 of the following year. Research has indicated that in buying the Standard & Poor’s 500 and holding from 2001 to 2010, the portfolio would have gained about 7% over this period. A buy & hold strategy would have produced -1%.
Commodities add value
The aforementioned addition of the commodities fund to the system finishes the puzzle. Commodities are important because they show a low correlation to stock equities. This low correlation can be thought of as a hedge against inflation. This arises from the tendency of commodities to increase in value with inflation, unlike many other assets. The underlying cause of this stems from the basic laws of supply and demand.
As the demand for goods and services outstrips supply, price rises, which creates more value in the commodities used to produce these goods and services. This permits the use of futures markets as clearing houses for recent information on supply and demand as well as continuous auction markets.

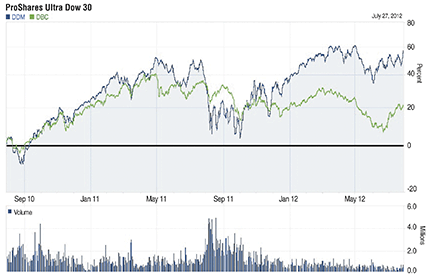
FIGURE 1: POWERSHARES DB COMMODITY INDEX TRACKING (DBC) VS. THE PROSHARES ULTRA DOW30 (DDM). The commodity fund DBC tracks a basket of commodities and the DDM fund provides twice the return of the Dow 30. Both funds are highly volatile and investing in each produces drawdowns of more than 50%. Yet allocating equal portions to each reduces volatility and provides superior returns when used with seasonal factors.
Excerpted from an article originally published in the October 2012 issue of Technical Analysis of Stocks & Commodities magazine. All rights reserved. © Copyright 2012, Technical Analysis, Inc.
Return to Contents
