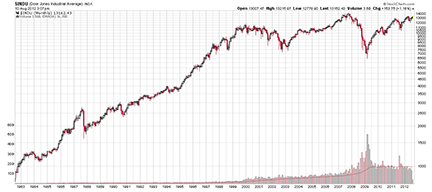
FIGURE 1: DOW JONES INDUSTRIAL AVERAGE, 1982–2012
ANNIVERSARY SPECIAL
A Random Walk Through Our Times
We share some perspective on where this industry has taken us over the past three decades.
Technical Analysis of Stocks & Commodities magazine turns 30 this month. Launched in October 1982, this magazine got its start when its publisher, Jack Hutson, couldn’t find very many places to turn to further his education in technical analysis. Published material on the subject was in short supply, and technical analysis was far from a common approach to investing in the markets.
Since he was a mechanical engineer for The Boeing Co. at the time, it made sense for him to adapt engineering methods to market analysis. After purchasing a copy of the original CompuTrac system in the late 1970s (a product later taken over by Telerate, and then sold to Dow Jones & Co.), Hutson developed a way to apply Fourier analysis to price cycles. His work in this led to an invitation to speak on the subject at a CompuTrac seminar in Toronto, Canada, in 1982. The presentation and paper that he prepared for that talk became material for the premier issue of Stocks & Commodities.
Today, technical analysis is a go-to approach for those looking for a more precise way to time their entries & exits in the market; or looking to guide their short-term trading; or for those who simply have a knack for mathematics and prefer a more mechanistic approach over fundamental analysis. Technical analysis has even become mainstream in many ways since the early days, with financial news networks presenting technical commentary and statistics, many websites offering free or paid charting services, and individual investors checking a stock’s chart before handing over their hard-earned dollars to the markets.
Technical analysis is the study of price charts and patterns. It seeks to apply various studies to price and volume charts to help analyze and forecast market cycles as well as small market movements. Traders might use a branch of technical analysis to forecast long-term, multiyear cycles in the broad markets, or they might use price patterns to predict the next tick on an intraday chart.
Technical analysis is a way to study the past to predict the future. In that spirit, let’s take a brief look back at the past 30 years of this magazine, the markets, and the securities industry — because where we’ve been is often just as important as where we’re heading.

FIGURE 1: DOW JONES INDUSTRIAL AVERAGE, 1982–2012