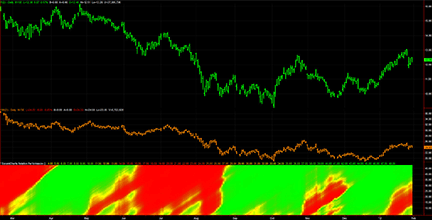
FIGURE 1: FORD (F) COMPARED TO GENERAL MOTORS (GM) WITH SWAMICHARTS RELATIVE PERFORMANCE. The SwamiCharts Relative Performance indicator is displayed in the bottom subgraph. Green means that F is outperforming GM and red means GM is outperforming F.
TRADING TECHNIQUES
Is There A Secret?
Use this tool to examine the relative price movement of a pair of stocks or exchange traded funds. It makes you look at the bigger picture and prevents you from making ill-considered decisions.
It’s no secret, really — it’s just a new trading approach that makes common sense. But to implement the approach, you need the proper tools. The basic concept was introduced about three decades ago by brokerage firm Morgan Stanley. The idea, known as pairs trading, calls for simultaneously trading two correlated stocks: one to the long side and the other to the short side. The risk reduction arises from the fact that some outside event such as a natural disaster will similarly affect both sides of the trade, with the result as a push on overall profits. One side will win due to the outside effect and the other side will lose.
The profitability arises from the break in correlation between the performances of the two stocks. For example, you might trade Ford (F) to the long side and General Motors (GM) to the short side if you believe the negative news stories about GM’s Volt automobile will adversely affect the company’s stock.
How correlated are they?
The traditional technical approach to pairs trading is to monitor the correlation coefficient between the prices of the two stocks. If stocks A and B go up together or go down together, their correlation is theoretically unity. The pairs trade makes a profit when the long side of the trade goes up and the short side of the trade goes down, or at least goes up at a reduced rate. In either of these cases the correlation between stocks A and B is decreased. Monitoring correlation coefficients is mathematical and a little arcane. There is a better way.

FIGURE 1: FORD (F) COMPARED TO GENERAL MOTORS (GM) WITH SWAMICHARTS RELATIVE PERFORMANCE. The SwamiCharts Relative Performance indicator is displayed in the bottom subgraph. Green means that F is outperforming GM and red means GM is outperforming F.