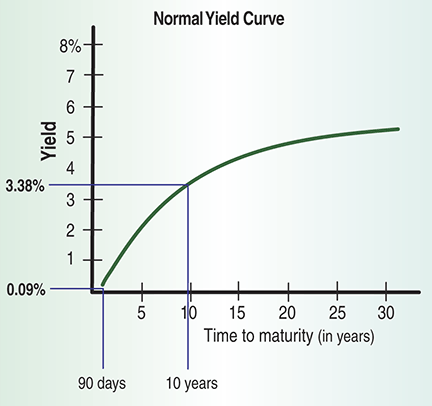
FIGURE 1: NORMAL YIELD CURVE. A normal yield curve suggests that long-term yields are higher than short-term yields.
INDICATORS
The Yield Curve Will Tell You
This oft-ignored indicator may have the answer.
When it comes to interest rates, few indicators are talked about more than the yield curve and yet, it is never used as a decision-making tool for buying and selling stocks. It remains in the background of discussions about when to buy, when to sell or, for the braver, more experienced investors, when to go short. During normal times, when long-term yields are higher than short-term ones, the yield curve looks like what you see in Figure 1. Today, for example, a 10-year Treasury note yields 1.57%, compared to the 90-day Treasury bill’s yield of 0.1%, or a yield premium of 1.47% points.

FIGURE 1: NORMAL YIELD CURVE. A normal yield curve suggests that long-term yields are higher than short-term yields.
Rising yield curve
Many economists think that a rising yield curve means that investors believe there will be strong economic growth in the foreseeable future. Throughout the 1990s, not only was the yield curve positive during the entire decade, but it was a steeply rising one, where the differential between short-term and long-term rates peaked in April 1992 — when, for example, the 10-year Treasury note yield of 7.58% was a full 3.81 percentage points higher than the three-month Treasury bill yield of 3.77%. The decade witnessed a period of declining interest rates that saw the fed funds rate decline from 8.32% on January 1, 1990, to 6.48% on December 27, 2000.
During the same period, the discount rate declined from 7.0% to 5.0%, and the prime rate declined from 10.5% to 9.0%. Crude oil prices steadily declined as well, averaging $20.68 per barrel, with a high of $39.88 on October 12, 1990, and a low of $11.00 on December 25, 1998. The US average prices of homes sold rose steadily from $153,400 as of January 1, 1991, to $208,100 on December 25, 2000, an increase of 35.7% over the 10-year period, an average annual increase of 3.097%.
All this resulted in the Standard & Poor’s 500 skyrocketing from 315.23 on January 1, 1991, to 1,320.28 on December 31, 2000, a nearly fourfold increase over the 10-year period. Never before in the history of the S&P 500 had such an explosion taken place.