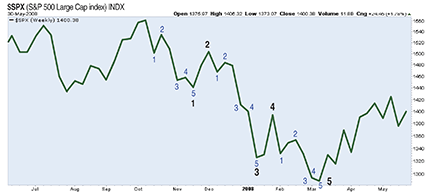
FIGURE 1: IMPULSE OR FIVE-WAVE PATTERN. This pattern indicates that the dominant trend is down.
FORECASTING
Objectivity And Theory
While there will always be subjective aspects to Elliott wave theory, there are also undeniable facts associated with the theory embodying some of its most profitable components. These facts can be used to trade the Elliott wave in an objective fashion as if it were a mechanical system.
The biggest knock on the Elliott wave theory has always been its subjectivity. To be sure, you can find as many Elliott wave market forecasts out there as there are Elliott wave analysts. This could leave the aspiring Elliottician feeling as though there were no black & white approach to trading a theory that otherwise has undeniable merit.
It doesn’t have to be that way. While there will always be subjective aspects to Elliott wave theory, there are also undeniable facts associated with it that embody some of its most profitable components.
These facts can be used to trade the Elliott wave theory in a completely objective fashion as if it were a mechanical system, and I will show you how. First, let’s discuss why the Elliott wave community seems to be such a divisive group and why it couldn’t matter less when it comes to the brass tacks of trading.
Wave direction
The entire purpose of the Elliott wave theory is to identify the direction of the trend on each time frame and trade in that direction. To accomplish this, Elliott practitioners use price charts to identify the direction in which impulsive or five-wave patterns are occurring. If the direction in which these patterns are occurring can be determined, it will tell the analyst the direction of the dominant trend on that time frame.
Take a look at Figure 1 for an example of an impulsive five-wave pattern. These patterns tend to be quick and strong, moving with little resistance as the trend is established or continued. Since impulsive or five-wave patterns were occurring to the downside in late 2007 and early 2008, it was a clear indication that the trend had turned down.

FIGURE 1: IMPULSE OR FIVE-WAVE PATTERN. This pattern indicates that the dominant trend is down.