TRADING SYSTEMS
Shifting Gears
Here’s how you can construct a simple Excel spreadsheet for the volatility switch indicator.
Which trading strategy should you use? This is a dilemma that most traders face, especially when the market changes its trend, which seems to be the norm these days. You may be dealing with a market that is reversing direction every few days, and without warning, the market breaks out into a lengthy trend that catches you off-guard. By the time you can adapt to the new mode, you could have sustained a considerable drawdown.
REGIME SWITCHING
Years ago, some very clever individuals came up with methods to cope with abrupt and dramatic changes. This concept was labeled “regime switching,” a method for adapting a trading strategy when the market changes from a trending mode to a mean-reverting one.

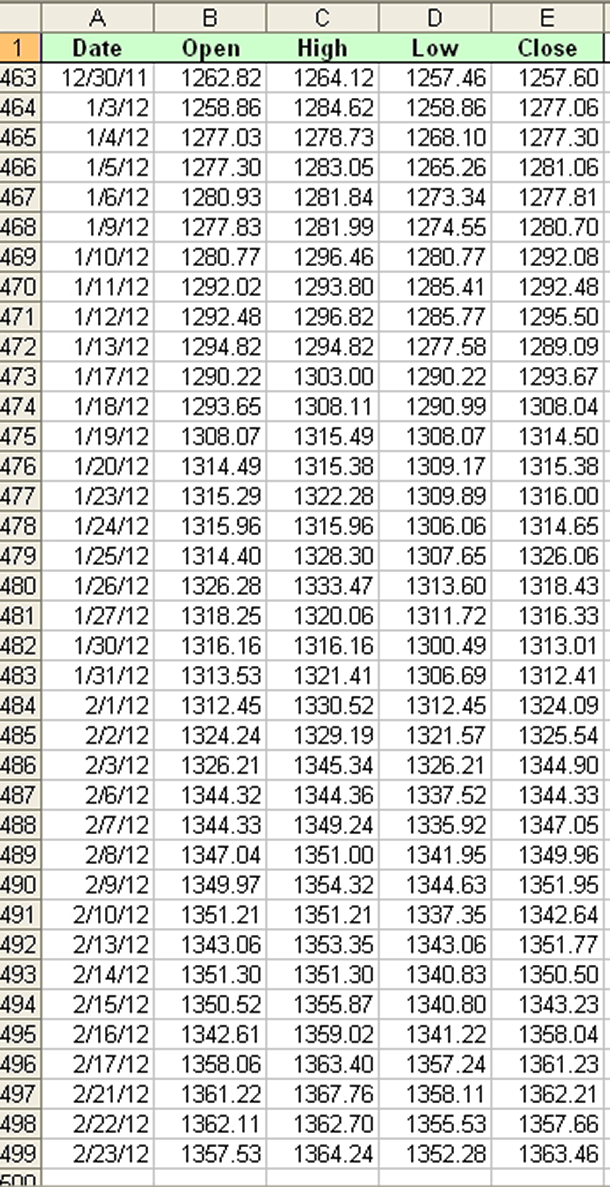
FIGURE 1: FIRST STEP. Enter daily data for open, high, low, and close.
Many regime switching algorithms are available today. They generally involve complex mathematical algorithms. At the heart of most of the regime switching strategies is a measure of volatility. The direction of volatility, rising or falling, as well as the level of volatility, will give a good indication of whether the market is in a trending or mean reversion mode. As a basic first step, this article will explain how to construct a simple volatility switch indicator to assist in determining whether your security of choice is trending or in a mean reversion mode.