INDICATORS
Under- And Overvaluation
Chartmill Value Indicator
Part 2
by Dirk Vandycke
In the first part of this series, you were introduced to an oscillator not prone to stickiness in overbought/oversold regions and that didn’t have the lag commonly associated with oscillators. In part 2, here’s how to apply it and profit from it.
When using the Chartmill value indicator (CVI), which is a short-term oscillator, I try to capture overbought and oversold setups. Based on a normalization procedure well-known to engineers and statisticians, the indicator’s construction makes for far different properties than those of most popular oscillators. To begin with, the CVI doesn’t have the stickiness that keeps other, range-bound oscillators in overbought and oversold zones while strong trends develop. Second, the lag typical for moving average-based oscillators is far less of an issue with the CVI. Finally, because of its adaptable dynamic nature, there are no parameters involved in its equation, so the CVI is totally objective by definition.
But it is still necessary to give it an objective interpretation. Let’s find out if this indicator is of any real and statistical significant usefulness.
CONSENSUAL VALUE
In my previous article I introduced the CVI and how it is built. Because of its normalizing nature, it can be used in the same way for any time series. Any value between -4 and +4 indicates a strong short-term consensus regarding current pricing as fair value. Any value between 4 and 8 indicates slight overvaluation, while anything higher than 8 indicates plain overpricing in the short term.

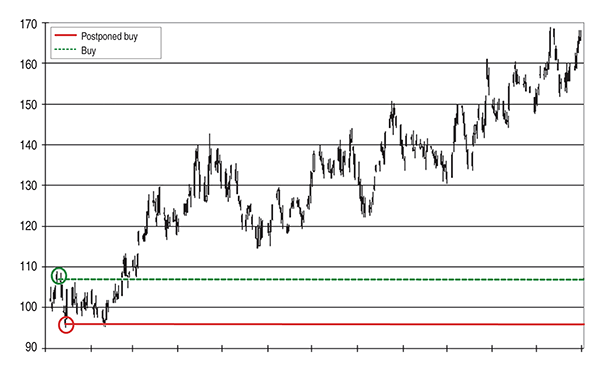
FIGURE 1: AN OVERVALUED BUY VERSUS AN UNDERVALUED BUY. What happens when you buy a setup not on the signal but on the first undervaluation (CVI<-8) that comes after? In this chart two entries are compared, coinciding with the highest and lowest CVI value for that week.
Excerpted from an article originally published in the February
2013 issue of Technical Analysis of Stocks & Commodities magazine. All rights reserved. © Copyright 2013, Technical Analysis, Inc.
Return to Contents
