 Explore Your Options
Q&A
 Explore Your Options
Got a question about options? Tom Gentile is the chief options strategist at Optionetics (www.optionetics.com), an education and publishing firm dedicated to teaching investors how to minimize their risk while maximizing profits using options. To submit a question, post it on the Stocks & Commodities website Message-Boards. Answers will be posted there, and selected questions will appear in future issues of S&C.
AN OPTION TWIST ON DOGS OF THE DOW
Dogs of the Dow is a stockpicking strategy devoted to selecting high-dividend stocks. Over time, the dogs have yielded about 50% more per year on average than simply buying the Dow Jones Industrial Average (DJIA). The last few years, however, the dogs have been mixed. Will this trend continue, or is there safety in buying the dogs in the event that the market will continue to stabilize?
Investing in the dogs is relatively simple. After the stock market closes on the last trading day of the year, of the 30 stocks that make up the DJIA, select the 10 stocks with the highest dividend yield. The strategy involves investing equal dollar amounts in each stock that qualifies as a dog. Then hold these 10 dogs for one year. Repeat annually. It can’t get any simpler than that.
The safety is in the dividend yields, and with the market down big again, dividends are higher than normal. There are a few that I like very much for more than this reason. Of the 10 dog stocks, take a look at the cheapest five, which are referred to as the “puppies of the Dow,” or the “Flying Five.” They offer a smaller stock price and are considered safer due to stock price. The investment strategy is no different from the 10 dogs. Let’s look at the five stocks over the last year (Figures 1 through 4).
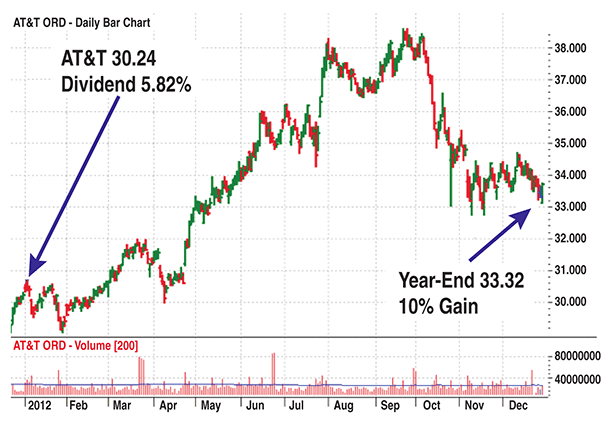
FIGURE 1: AT&T, DAILY, 2012
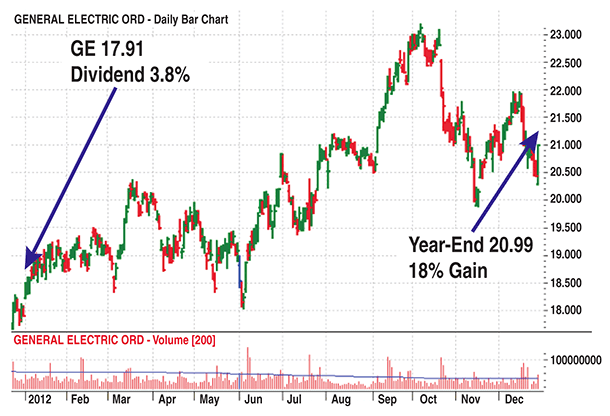
FIGURE 2: GE, DAILY, 2012
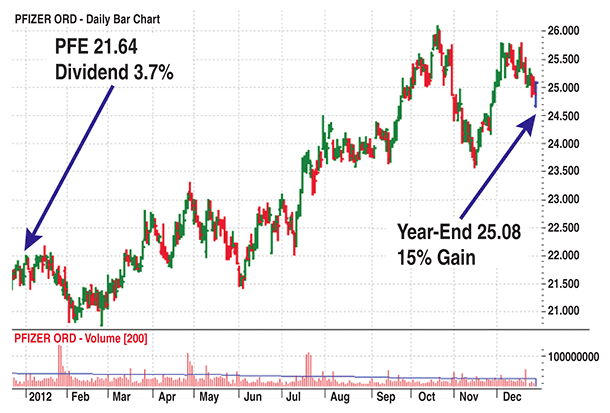
FIGURE 3: PFIZER, DAILY, 2012
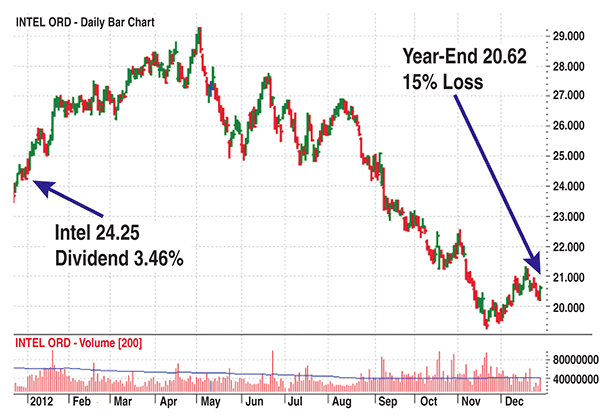
FIGURE 4: INTEL, DAILY, 2012
The final stock that qualified for the Flying Five was Kraft Foods (KFT), which changed its name to Mondelēz International in October 2012. At the beginning of 2013, KFT was trading at $37.36 with a dividend payout of $3.10. On October 1, the date of the announcement, the stock was at $41.08, a gain of 10%. Unfortunately, a current chart was not available due to the spinoff.
Nevertheless, it was a positive year for the dogs of the Dow, as well as the Flying Five, though they underperformed the DJIA as a whole, not something that happens a lot.
COLLECTING DIVIDENDS
Part of this strategy that appeals to investors is the ability to take in above-average dividend yields. When it comes to dividend payouts, there are four dates to pay attention to:
Declaration date: The date on which the dividend payment is announced by the company. This would include the dividend’s size, ex-dividend date, and payment date. It is also referred to as the “announcement date.”
Ex-dividend date: The date on or before you must own the stock by in order to receive the dividend payout. If you purchase the stock after the ex-dividend date, the seller will receive the dividend. This is normally two business days before the dividend is released to shareholders.
Record date: A date showing an accounting of all shareholders on record to receive a payable dividend.
Payable date: The date on which the dividend is paid out to shareholders.
In order to get the dividend, you would have to own the stock before the ex-dividend date. You would then get your dividend on what is referred to as the payable date. The good news is that based on our one-year strategy, this is not a problem. We will be holding the stock through the entire year of dividend cycles.
SELLING COVERED CALLS
To increase our odds of success, selling a simple call option will bring in additional income, which will be kept throughout the life of the option; this is a covered call. Selling covered calls will reduce the overall cost of the investment and also reduce the breakeven on the investment over the course of the year.
For every 100 shares of stocks we own, we will look to sell one call option as close to the stock price as possible to receive the most premium we can. We will now sit tight as the stocks and options move until we get closer to expiration to receive the full income from the options we sold against the stock.
Most people trade covered calls on a monthly basis to collect income off stocks they may own. The dogs of the Dow are different in that you cannot sell monthly call options to collect income and the premiums received are too small. You have to think longer term. That means selling longer-term premium.
Let’s take a look at the five stocks that qualify for the 2011 dogs of the Dow and examples of covered calls on them (Figure 5).
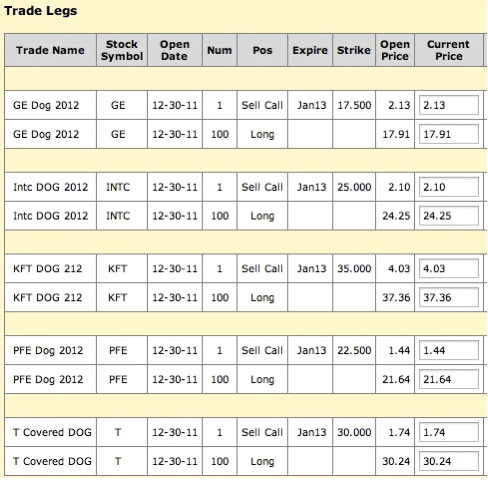
FIGURE 5: FLYING FIVE
First, you will see that for every 100 shares, the stocks are covered with one call option. Those options brought in premium as well. So how do we calculate the cost and total return of each? Simple:
Cost = Stock price (minus) dividend (minus) call premium
Total return = Amount received from dividends and call premium. Then we calculate
Call strike – stock price
If the number is positive, we add it to our dividend and call premium. If it’s negative, we subtract it from our dividend and call premium.
Total return % – total return/stock price
Example: GE stock priced at $17.91, calls brought in 2.13, and expected dividends are 3.8%, or $0.68.
Cost = Stock price ($17.91) – dividend ($0.68) – call premium (2.13)
Cost = $15.10
Total return = 2.81 received from dividends and call premium
Strike price = Stock price $17.50 – 17.91
= $0.41 in-the-money
2.13 – $0.41 = 1.72
Total return = 1.72
Total return % = 1.72/15.10
Total return % = 11.3%
The average return potential I see each year with this strategy is about 10–12%. Compare this with the puppies of the DJIA that return an average of close to 12% in the last 20 years. Why would we learn a strategy involving options that returns less than simply buying and selling the stock alone?
What you may not see is that you also have an average 10–12% cushion in the event that the market has a bad year. In 2008, when the market slumped, using this strategy wouldn’t have produced a profit, but it would have nearly cut your losses in half. You may think 10–12% a year isn’t much, but it adds up, and remember, this takes very little work on your part.
There are other alternatives to simply buying the stock and selling a one-year option as protection. You could sell quarterly options, but it takes more maintenance. While this, like any option strategy, isn’t perfect or a guaranteed way of making risk-free income, it does look interesting when you weigh the long-term pros and cons.