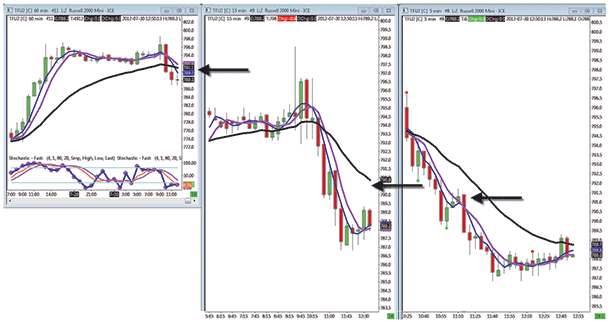
FIGURE 1: STRONG TRENDING DAY. The market retraced off its major resistance and returns to its established trend on the five-minute chart. The 21-period EMA is quite steep, indicating that the downtrend is strong.
CHARTING
Seeing The Undercurrents
This new twist to applying multiple time frame analysis will help you refine your entry and exit points.
Multiple time frame analysis (MTA) is not a new concept to traders but it can be examined in a new way, making it a more robust tool. The concept can be used in conjunction with any trading strategy, and it works well for most markets that can be traded. MTA allows you to set up your trading desktop and:
Most traders trade with the market trend, buying or selling retracements against the prevailing one. However, many traders become frustrated when the retracement they buy or sell is actually an inflection point in the market, leaving them in a trade against the new trend, ultimately leading to a stopout and fewer profitable trades.

FIGURE 1: STRONG TRENDING DAY. The market retraced off its major resistance and returns to its established trend on the five-minute chart. The 21-period EMA is quite steep, indicating that the downtrend is strong.
GOING WITH THE TREND
Determining the market trend is key to improving the profitability of trades. By working with the trend, a trader is able to trade with the market and not against the direction of the market. Trend analysis provides information at both micro and macro levels to determine whether a market move is more likely to be a retracement or a change in direction. By incorporating supporting charts to their favorite time frames, traders are able to better determine the prevailing trend of the market.