INDICATORS
A Visual Approach
The Average Age Of Averages
by Giorgos E. Siligardos, PhD
Have you ever considered why you use 2/(n+1) as a smoothing parameter when using exponential moving averages? Here you will find a simple explanation.
When you’re using an n-period exponential moving average, do you ever think about why it has a smoothing parameter of 2/(n + 1)? And even if you did, there is a chance you may not understand why this formula exists and how it is derived. Let me explain in simple and visual terms the underlying reasoning behind the use of 2/(n + 1) as a smoothing parameter.
While exponential smoothing was originated by Charles Holt in 1957 and Robert Goodell Brown in 1959, the first who used exponential smoothing to track stock prices was most likely P.N. Haurlan, a rocket scientist from the Jet Propulsion Laboratory of NASA in the early 1960s. Haurlan published his work on the subject in his 1968 booklet Measuring Trend Values (see “Suggested reading”).
The first connection between the simple moving average (SMA) and the exponential moving average (EMA) along with the 2/(n + 1) conversion formula was presented in Brown’s 1963 book, Smoothing, Forecasting And Prediction of Discrete Time Series. Later, the conversion formula became broadly adapted by technical analysts after the publication of Jack Hutson’s 1984 article “Filter Price Data: Moving Averages Vs. Exponential Moving Averages” in Technical Analysis of Stocks & Commodities (see “Suggested reading”).

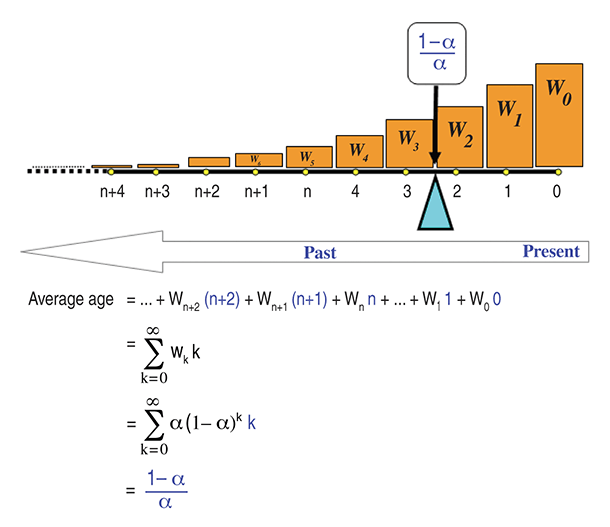
FIGURE 1: EXPONENTIAL AVERAGE WEIGHTING SCHEME OF TIME MOMENTS. The cyan triangular fulcrum under the weightless time bar touches the bar at time moment (1-α)/α and balances the whole system. The (1-α)/α is exactly the average age (AA) of the exponential average weighting scheme and it is the result of exponentially averaging the time moments from zero to infinity. As a result, the exponential average of price data lags behind the most recent price by AA.
Excerpted from an article originally published in the March 2013 issue of Technical Analysis of Stocks & Commodities magazine. All rights reserved. © Copyright 2013, Technical Analysis, Inc.
Return to Contents
