
For this month’s Traders’ Tips, the focus is is Slawomir Bobrowski’s article in this issue, “Camarilla Points.” Here we present the March 2013 Traders’ Tips code with possible implementations in various software.
TRADERS’ TIPS
Here is this month’s selection of Traders’ Tips, contributed by various developers of technical analysis software to help readers more easily implement some of the strategies presented in this and other issues.
Other code appearing in articles in this issue is posted in the Subscriber Area of our website at https://technical.traders.com/sub/sublogin.asp. Login requires your last name and subscription number (from mailing label). Once logged in, scroll down to beneath the “Optimized trading systems” area until you see “Code from articles.” From there, code can be copied and pasted into the appropriate technical analysis program so that no retyping of code is required for subscribers.
You can copy these formulas and programs for easy use in your spreadsheet or analysis software. Simply “select” the desired text by highlighting as you would in any word processing program, then use your standard key command for copy or choose “copy” from the browser menu. The copied text can then be “pasted” into any open spreadsheet or other software by selecting an insertion point and executing a paste command. By toggling back and forth between an application window and the open web page, data can be transferred with ease.

For this month’s Traders’ Tips, the focus is is Slawomir Bobrowski’s article in this issue, “Camarilla Points.” Here we present the March 2013 Traders’ Tips code with possible implementations in various software.

In “Camarilla Points” in this issue, author Slawomir Bobrowski describes the calculation and use of camarilla pivot values for chart analysis and trading. Bobrowski suggests that the camarilla values provide general areas of support and resistance, and he provides some trading ideas around these values.
Provided here is a function that calculates camarilla pivot values; an indicator that plots the values; and a strategy. The indicator illustrates new functionality implemented in Trade-Station 9.1, update 13, which uses a transparent plot color to eliminate connector lines when new pivot values are calculated. (See Figure 1.)
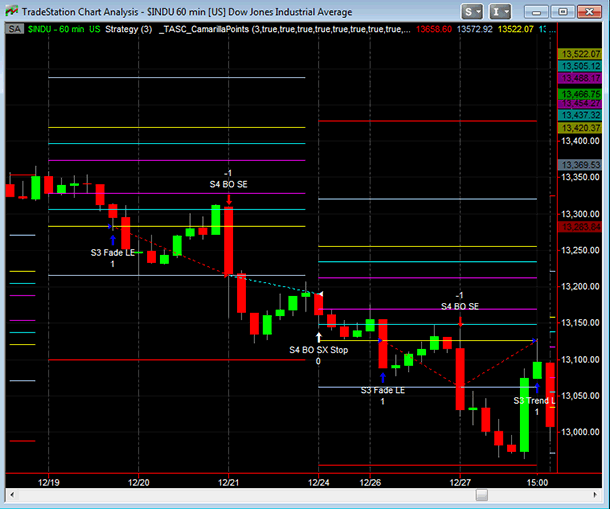
FIGURE 1: TRADESTATION. The camarilla-based indicator and strategy are applied to an hourly bar chart of $INDU with both set to three days. The use of transparent plot colors (see accompanying EasyLanguage code) eliminates the connector lines when new pivot levels are calculated.
The strategy we’re providing here is for illustrative purposes only. It has various entries and exits (both fade and trend-following) for the various camarilla levels.
To download the EasyLanguage code for the strategy, first navigate to the EasyLanguage FAQs and reference posts topic in the EasyLanguage support forum (https://www.tradestation.com/Discussions/Topic.aspx?Topic_ID=47452), scroll down, and click on the link labeled “Traders’ Tips, TASC.” Then select the appropriate link for the issue month and year. The ELD filename is “_TASC_CamarillaPoints.ELD.”
The code is also shown below.
_TASC_CamarillaPointsFunc (Function)

{ TASC Article, March, 2013 }
{ "Camarilla Points" }
{ Slawomir Bobrowski }
{ compile as integer return type }
{ see notes below for multiple output functions }

inputs:
	int NumDays( numericsimple ), { pass in the number
	 of days to be used as the time frame for pivot
	 calculations; for example, if 15 is passed in,
	 the High/Low/Close of the last 15 days is used
	 for calculation of the pivot values and those
	 values are plotted for the next 15 days }
	double oR1( numericref ),
	double oR2( numericref ),
	double oR3( numericref ),
	double oR4( numericref ),
	double oR5( numericref ),
	double oS1( numericref ),
	double oS2( numericref ),
	double oS3( numericref ),
	double oS4( numericref ),
	double oS5( numericref ),
	bool NewCalc( truefalseref ) ; { this input is
	 used to pass back (via the variable) true if
	 the current bar is calculating new pivot values }

variables:
	bool CalcTrigger( false ),
	int DayCounter( -1 ),
	double RangeHigh( 0 ),
	double RangeLow( 99999999999999 ),
	double PeriodRange( 0 ),
	double PeriodClose( 0 ),
	double R1( 0 ),
	double R2( 0 ),
	double R3( 0 ),
	double R4( 0 ),
	double R5( 0 ),
	double S1( 0 ),
	double S2( 0 ),
	double S3( 0 ),
	double S4( 0 ),
	double S5( 0 ) ;

{
increment day counter when a new session begins;
this calculation assumes regular session is being
used
}
if CurrentSession( 0 ) <> CurrentSession( 0 )[1] then
	DayCounter += 1 ;

{ detect new time period so that new pivot
  calculations can be made }
CalcTrigger = Mod( DayCounter, NumDays ) = 0
 and DayCounter <> DayCounter[1] ;

if CalcTrigger then { calculate new pivot values }
	begin
	if DayCounter >= NumDays then { ensure there is
	 enough data for valid values }
		begin
		PeriodRange = RangeHigh - RangeLow ;
		PeriodClose = Close[1] ;

		{ calculate new Camarilla pivot values}
		R5 = ( RangeHigh / RangeLow ) * PeriodClose ;
		R4 = PeriodClose + PeriodRange * ( 1.1 ) / 2 ;
		R3 = PeriodClose + PeriodRange * ( 1.1 ) / 4 ;
		R2 = PeriodClose + PeriodRange * ( 1.1 ) / 6 ;
		R1 = PeriodClose + PeriodRange * ( 1.1 ) / 12 ;
		S1 = PeriodClose - PeriodRange * ( 1.1 ) / 12 ;
		S2 = PeriodClose - PeriodRange * ( 1.1 ) / 6 ;
		S3 = PeriodClose - PeriodRange * ( 1.1 ) / 4 ;
		S4 = PeriodClose - PeriodRange * ( 1.1 ) / 2 ;
		S5 = ( PeriodClose - ( R5 - PeriodClose ) ) ;

		end ;
	RangeHigh = High ;
   	RangeLow = Low ;
	end
else if DayCounter >= 0 then
	begin
	if High > RangeHigh then
		RangeHigh = High ;
	if Low < RangeLow then
		RangeLow = Low ;
	end ;

{ assign reference variable values }
oR1 = R1 ;
oR2 = R2 ;
oR3 = R3 ;
oR4 = R4 ;
oR5 = R5 ;
oS1 = S1 ;
oS2 = S2 ;
oS3 = S3 ;
oS4 = S4 ;
oS5 = S5 ;
NewCalc = CalcTrigger ;

_TASC_CamarillaPointsFunc = 1 ;

{ force function to be series so that period Highs
  and Lows can be tracked }
once
	Value99 = R1[1] ;


{
MULTIPLE-OUTPUT FUNCTIONS

A multiple-output function has two types of parameters
or "inputs" - input parameters and input/output
parameters.  The values of the input parameters are
passed into the multiple-output function, but not
modified by the function.  The values of the input/
output parameters are passed into the multiple-output
function, modified by it, and the modified values
are then inherited by - or output to - the calling
routine.

The input/output parameters are often used for output
purposes only, i.e., the incoming values are ignored.
The outputs are in addition to the function return.
In multiple-output functions, the function return is
generally used to return an error code, though
sometimes the return may simply be a dummy value.

The input/output parameters are declared with a "ref"
suffix (such as "numericref") in the multiple-output
function's declaration statements.  For further
clarity, the names of the input/output parameters are
generally prefixed with an "o" in the function as
well as in all the routines that call the function.

The built-in single-return WRAPPER FUNCTIONS that call
the multiple-output functions are specialized calling
routines designed to offer simplified, alternate
pathways to the functionality of the underlying
multiple-output functions.  In the wrapper functions,
the input/output parameters are declared as local
variables and generally initialized to zero.  They are
passed through to the multiple-output function without
further modification.  After the call, the wrapper
function picks out the single output of interest and
assigns it as the return of the wrapper function.
}


_TASC_CamarillaPoints (Indicator)


{ TASC Article, March, 2013 }
{ "Camarilla Points" }
{ Slawomir Bobrowski }
{ Code works with 9.1, Update 13 and later }

inputs:
	int NumDays( 15 ), { enter the number of days to
	 be used as the time frame for pivot
	 calculations; for example, if 15 is entered, the
	 High/Low/Close of the last 15 days is used for
	 calculation of the pivot values and those values
	 are plotted for the next 15 days }
	bool PlotR1( true ), { set to true to plot R1 }
	bool PlotR2( true ), { set to true to plot R2 }
	bool PlotR3( true ), { set to true to plot R3 }
	bool PlotR4( true ), { set to true to plot R4 }
	bool PlotR5( true ), { set to true to plot R5 }
	bool PlotS1( true ), { set to true to plot S1 }
	bool PlotS2( true ), { set to true to plot S2 }
	bool PlotS3( true ), { set to true to plot S3 }
	bool PlotS4( true ),{ set to true to plot S4 }
	bool PlotS5( true ) ; { set to true to plot S5 }

variables:
	double R1( 0 ),
	double R2( 0 ),
	double R3( 0 ),
	double R4( 0 ),
	double R5( 0 ),
	double S1( 0 ),
	double S2( 0 ),
	double S3( 0 ),
	double S4( 0 ),
	double S5( 0 ),
	bool NewPeriod( false ) ;

{ obtain levels from function }
Value1 = _TASC_CamarillaPointsFunc( NumDays, R1, R2,
 R3, R4, R5, S1, S2, S3, S4, S5, NewPeriod ) ;

if R1 <> 0 then { ensure values have been calculated
 prior to plotting }
	begin
	if PlotR5 then Plot1( R5, "R5" ) ;
	if PlotR4 then Plot2( R4, "R4" ) ;
	if PlotR3 then Plot3( R3, "R3" ) ;
	if PlotR2 then Plot4( R2, "R2" ) ;
	if PlotR1 then Plot5( R1, "R1" ) ;
	if PlotS1 then Plot6( S1, "S1" ) ;
	if PlotS2 then Plot7( S2, "S2" ) ;
	if PlotS3 then Plot8( S3, "S3" ) ;
	if PlotS4 then Plot9( S4, "S4" ) ;
	if PlotS5 then Plot10( S5, "S5" ) ;
	end ;

{ remove connector lines when new pivot levels are
  calculated; this code works in 9.1, Update 13 and
  later }
 if NewPeriod then
 	begin
 	SetPlotColor[1]( 1, transparent ) ;
 	SetPlotColor[1]( 2, transparent ) ;
 	SetPlotColor[1]( 3, transparent ) ;
 	SetPlotColor[1]( 4, transparent ) ;
 	SetPlotColor[1]( 5, transparent ) ;
 	SetPlotColor[1]( 6, transparent ) ;
 	SetPlotColor[1]( 7, transparent ) ;
 	SetPlotColor[1]( 8, transparent ) ;
 	SetPlotColor[1]( 9, transparent ) ;
 	SetPlotColor[1]( 10, transparent ) ;
 	end ;


_TASC_CamarillaPoints_Strat (Strategy)


{ TASC Article, March, 2013 }
{ "Camarilla Points" }
{ Slawomir Bobrowski }
{ this strategy is for illustrative purposes only and
  was not designed to be traded }

[Intrabarordergeneration = true]

inputs:
	int NumDays( 15 ) ; { enter the number of days to
	 be used as the time frame for pivot
	 calculations; for example, if 15 is entered, the
	 High/Low/Close of the last 15 days is used for
	 calculation of the pivot values and those values
	 are plotted for the next 15 days }

variables:
	double R1( 0 ),
	double R2( 0 ),
	double R3( 0 ),
	double R4( 0 ),
	double R5( 0 ),
	double S1( 0 ),
	double S2( 0 ),
	double S3( 0 ),
	double S4( 0 ),
	double S5( 0 ),
	int DayCounter( 0 ),
	bool NewPeriod( false ) ;

{ obtain levels from function }
Value1 = _TASC_CamarillaPointsFunc( NumDays, R1, R2,
 R3, R4, R5, S1, S2, S3, S4, S5, NewPeriod ) ;

{ entries and exits }
if R1 > 0 then { no trades until valid calculations
 are available }
	begin

	{ fade R3 short entry }
	if Close < R3 then
		SellShort ( "R3 Fade SE" ) next bar R3 Limit ;

	{ fade S3 long entry }
	if Close > S3 then
		Buy ( "S3 Fade LE" ) next bar S3 Limit ;

	{ trend trade cross S3 long entry }
	if Close < S3 then
		Buy ( "S3 Trend LE" ) next bar S3 stop ;

	{ trend trade cross R3 short entry }
	if Close > R3 then
		SellShort ( "R3 Trend SE" ) next bar R3 stop ;

	{ R4/S4 breakout entries }
	if Close < R4 then
		Buy ( "R4 BO LE" ) next bar R4 stop ;

	if Close > S4 then
		SellShort( "S4 BO SE" ) next bar S4 stop ;

	{ long exits }
	Sell ( "S3 Fade LX" ) from entry ( "S3 Fade LE" )
	 next bar S4 stop ;
	Sell ( "S3 Trend LX" ) from entry
	 ( "S3 Trend LE" ) next bar S4 stop ;
	Sell ( "R4 BO LX Stop" ) from entry ( "R4 BO LE" )
	 next bar R3 stop ;
	Sell ( "R4 BO LX Tgt" ) from entry ( "R4 BO LE" )
	 next bar R5 limit ;

	{ short exits }
	BuyToCover ( "R3 Fade SX" ) from entry
	 ( "R3 Fade SE" ) next bar R4 stop ;
	BuyToCover ( "R3 Trend SX" ) from entry
	 ( "R3 Trend SE" ) next bar R4 stop ;
	BuyToCover ( "S4 BO SX Stop" ) from entry
	 ( "S4 BO SE" ) next bar S3 stop ;
	BuyToCover ( "S4 BO SX Tgt" ) from entry
	 ( "S4 BO SE" ) next bar S5 limit ;

	end ;
This article is for informational purposes. No type of trading or investment recommendation, advice, or strategy is being made, given, or in any manner provided by TradeStation Securities or its affiliates.

Slawomir Bobrowski’s article in this issue introduces trading with camarilla points. His technique can be replicated in MetaStock using the following formula that draws the lines:
x:= Input("time frame", 1, 50, 15);
new:=Mod(Cum(1),x) = 0;
yh:=ValueWhen(1,new, Ref(HighestSince(1,new,H),-1));
yl:=ValueWhen(1,new, Ref(LowestSince(1,new,L),-1));
yc:=ValueWhen(1,new, Ref(C,-1));
r:=yh-yl;

r1:= yc+r*1.1/12;
s1:= yc-r*1.1/12;
r2:= yc+r*1.1/6;
s2:= yc-r*1.1/6;
r3:= yc+r*1.1/4;
s3:= yc-r*1.1/4;
r4:= yc+r*1.1/2;
s4:= yc-r*1.1/2;
r5:= yc*(yh/If(yl<=0,yc,yl));
s5:= yc-(r5-yc);

r5;
r4;
r3;
r2;
r1;
s1;
s2;
s3;
s4;
s5;

For this month’s Traders’ Tip, we’ve provided the formula “CamarillaPoints.efs” based on Slawomir Bobrowski’s article in this issue, “Camarilla Points.”
The study contains a formula parameter to set the colors for resistance & support levels, buy & sell signals, and the time frame period, which may be configured through the Edit Chart window.
To discuss this study or download a complete copy of the formula code, please visit the EFS Library Discussion Board forum under the forums link from the support menu at www.esignal.com or visit our EFS KnowledgeBase at www.esignal.com/support/kb/efs/. The eSignal formula scripts (EFS) are also available for copying and pasting below.
A sample chart is shown in Figure 2.
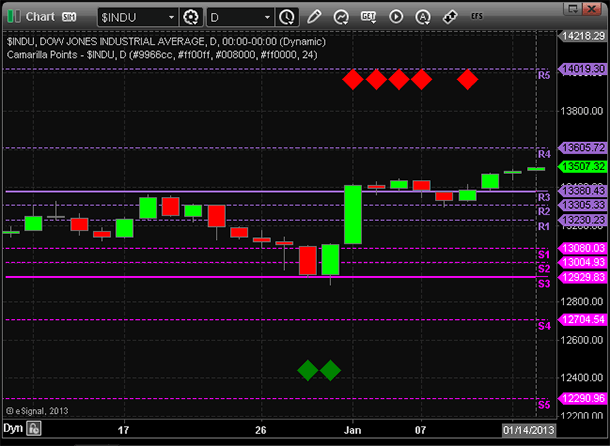
FIGURE 2: eSIGNAL
/*********************************
Provided By:
eSignal (Copyright c eSignal), a division of Interactive Data
Corporation. 2012. All rights reserved. This sample eSignal
Formula Script (EFS) is for educational purposes only and may be
modified and saved under a new file name.  eSignal is not responsible
for the functionality once modified.  eSignal reserves the right
to modify and overwrite this EFS file with each new release.

Description:
    Camarilla Points, by Slawomir Bobrowski

Version:            1.00  01/10/2013

Formula Parameters:                         Default:
Resistance level Color                      purple

Support Level Color                         magenta

Buy Signal Color                            green

Sell Signal Color                           red

Time Frame Period                           15


Notes:
The related article is copyrighted material. If you are not a subscriber
of Stocks & Commodities, please visit www.traders.com.

**********************************/

var fpArray = new Array();

function preMain()
{
    setPriceStudy(true);

    setStudyTitle("Camarilla Points");


    setCursorLabelName("R5",0);

    setPlotType(PLOTTYPE_FLATLINES,0);

    setCursorLabelName("R4",1);

    setPlotType(PLOTTYPE_FLATLINES,1);

    setCursorLabelName("R3",2);

    setPlotType(PLOTTYPE_FLATLINES,2);

    setCursorLabelName("R2",3);

    setPlotType(PLOTTYPE_FLATLINES,3);

    setCursorLabelName("R1",4);

    setPlotType(PLOTTYPE_FLATLINES,4);


    setCursorLabelName("S1",5);

    setPlotType(PLOTTYPE_FLATLINES,5);

    setCursorLabelName("S2",6);

    setPlotType(PLOTTYPE_FLATLINES,6);

    setCursorLabelName("S3",7);

    setPlotType(PLOTTYPE_FLATLINES,7);

    setCursorLabelName("S4",8);

    setPlotType(PLOTTYPE_FLATLINES,8);

    setCursorLabelName("S5",9);

    setPlotType(PLOTTYPE_FLATLINES,9);


    var x = 0;

    fpArray[x] = new FunctionParameter("gRColor", FunctionParameter.COLOR);
    with(fpArray[x++])
    {
        setName("Resistance level Color");
        setDefault(Color.purple);
    }


    fpArray[x] = new FunctionParameter("gSColor", FunctionParameter.COLOR);
    with(fpArray[x++])
    {
        setName("Support Level Color");
        setDefault(Color.magenta);
    }


    fpArray[x] = new FunctionParameter("gBuyColor", FunctionParameter.COLOR);
    with(fpArray[x++])
    {
        setName("Buy Signal Color");
        setDefault(Color.green);
    }


    fpArray[x] = new FunctionParameter("gSellColor", FunctionParameter.COLOR);
    with(fpArray[x++])
    {
        setName("Sell Signal Color");
        setDefault(Color.red);
    }


    fpArray[x] = new FunctionParameter("gDays", FunctionParameter.NUMBER);
    with(fpArray[x++])
    {
        setName("Time Frame Period");
        setDefault(15);
    }
}

var bInit = false;
var bVersion = null;


var xHHigh  = null;

var xLLow   = null;

var xClose = null;


var xHigh  = null;

var xLow   = null;


var nR1 = null;

var nS1 = null;

var nR2 = null;

var nS2 = null;

var nR3 = null;

var nS3 = null;

var nR4 = null;

var nS4 = null;

var nR5 = null;

var nS5 = null;


function main(gRColor,gSColor,gBuyColor,gSellColor,gDays)
{
    if (bVersion == null) bVersion = verify();
    if (bVersion == false) return;


    setDefaultBarFgColor(gRColor, 0);

    setBarStyle(PS_DASH,0);

    setDefaultBarFgColor(gRColor, 1);

    setBarStyle(PS_DASH,1);

    setDefaultBarFgColor(gRColor, 2);

    setDefaultBarThickness(2,2);

    setDefaultBarFgColor(gRColor, 3);

    setBarStyle(PS_DASH,3);

    setDefaultBarFgColor(gRColor, 4);

    setBarStyle(PS_DASH,4);


    setDefaultBarFgColor(gSColor, 5);

    setBarStyle(PS_DASH,5);

    setDefaultBarFgColor(gSColor, 6);

    setBarStyle(PS_DASH,6);

    setDefaultBarFgColor(gSColor, 7);

    setDefaultBarThickness(2,7);

    setDefaultBarFgColor(gSColor, 8);

    setBarStyle(PS_DASH,8);

    setDefaultBarFgColor(gSColor, 9);

    setBarStyle(PS_DASH,9);


    if(!bInit)
    {
        xHHigh  = highest(gDays,high());

        xLLow   = lowest(gDays,low());

        xClose = close();


        xHigh = high();

        xLow = low();


        bInit = true;

    }


    if (getBarState()==BARSTATE_ALLBARS)

    {

        nR5 = nR4 = nR3 = nR2 = nR1 = null;

        nS1 = nS2 = nS3 = nS4 = nS5 = null;

    }


    if ((getCurrentBarIndex()-1) % (gDays) == 0)

    {

        var nHHigh  = xHHigh.getValue(-1);

        var nLLow   = xLLow.getValue(-1);

        var nClose = xClose.getValue(-1);


        if(nHHigh == null || nLLow == null || nClose == null || nLLow == 0)

        return;


        var nRange = nHHigh-nLLow;


        nR5 = (nHHigh/nLLow)*nClose;

        nR4 = nClose+nRange*1.1/2;

        nR3 = nClose+nRange*1.1/4;

        nR2 = nClose+nRange*1.1/6;

        nR1 = nClose+nRange*1.1/12;


        nS1 = nClose-nRange*1.1/12;

        nS2 = nClose-nRange*1.1/6;

        nS3 = nClose-nRange*1.1/4;

        nS4 = nClose-nRange*1.1/2;

        nS5 = nClose-(nR5-nClose);


        drawTextAbsolute(getCurrentBarIndex()+gDays-1, nR1, " R1 ", gRColor, null, Text.LEFT | Text.BOLD | Text.ONTOP, null, null,getCurrentBarIndex());

        drawTextAbsolute(getCurrentBarIndex()+gDays-1, nR2, " R2 ", gRColor, null, Text.LEFT | Text.BOLD | Text.ONTOP, null, null,getCurrentBarIndex()+1);

        drawTextAbsolute(getCurrentBarIndex()+gDays-1, nR3, " R3 ", gRColor, null, Text.LEFT | Text.BOLD | Text.ONTOP, null, null,getCurrentBarIndex()+2);

        drawTextAbsolute(getCurrentBarIndex()+gDays-1, nR4, " R4 ", gRColor, null, Text.LEFT | Text.BOLD | Text.ONTOP, null, null,getCurrentBarIndex()+3);

        drawTextAbsolute(getCurrentBarIndex()+gDays-1, nR5, " R5 ", gRColor, null, Text.LEFT | Text.BOLD | Text.ONTOP, null, null,getCurrentBarIndex()+4);


        drawTextAbsolute(getCurrentBarIndex()+gDays-1, nS1, " S1 ", gSColor, null, Text.LEFT | Text.BOLD | Text.ONTOP, null, null,getCurrentBarIndex()+5);

        drawTextAbsolute(getCurrentBarIndex()+gDays-1, nS2, " S2 ", gSColor, null, Text.LEFT | Text.BOLD | Text.ONTOP, null, null,getCurrentBarIndex()+6);

        drawTextAbsolute(getCurrentBarIndex()+gDays-1, nS3, " S3 ", gSColor, null, Text.LEFT | Text.BOLD | Text.ONTOP, null, null,getCurrentBarIndex()+7);

        drawTextAbsolute(getCurrentBarIndex()+gDays-1, nS4, " S4 ", gSColor, null, Text.LEFT | Text.BOLD | Text.ONTOP, null, null,getCurrentBarIndex()+8);

        drawTextAbsolute(getCurrentBarIndex()+gDays-1, nS5, " S5 ", gSColor, null, Text.LEFT | Text.BOLD | Text.ONTOP, null, null,getCurrentBarIndex()+9);


    }


    var nHigh = xHigh.getValue(0);

    var nLow = xLow.getValue(0);


    if(nHigh == null || nLow == null)

    return;


    if ((nR3<nHigh) && (nR3>nLow)) drawShapeRelative(0, TopRow3 , Shape.DIAMOND, null, gSellColor, Shape.PRESET);

    if ((nS3<nHigh) && (nS3>nLow)) drawShapeRelative(0, BottomRow3 , Shape.DIAMOND, null, gBuyColor, Shape.PRESET);


    return new Array(nR5,nR4,nR3,nR2,nR1,nS1, nS2, nS3,nS4,nS5);

}


function verify() {
    var b = false;
    if (getBuildNumber() < 779) {
        drawTextAbsolute(5, 35, "This study requires version 8.0 or later.",
            Color.white, Color.blue, Text.RELATIVETOBOTTOM|Text.RELATIVETOLEFT|Text.BOLD|Text.LEFT,
            null, 13, "error");
        drawTextAbsolute(5, 20, "Click HERE to upgrade.@URL=https://www.esignal.com/download/default.asp",
            Color.white, Color.blue, Text.RELATIVETOBOTTOM|Text.RELATIVETOLEFT|Text.BOLD|Text.LEFT,
            null, 13, "upgrade");
        return b;
    } else {
        b = true;
    }
    return b;
}

In “Camarilla Points” in this issue, author Slawomir Bobrowski discusses the importance of using and understanding pivot points. The article focuses on using camarilla points as the basis for pivot points.
For thinkorswim users, we have created a study based on Bobrowski’s article in our proprietary scripting language, thinkScript. Once the study has been added, you can adjust the parameters of the study within the Edit Studies window to fine tune your new pivot points.
The study:
input aggregationPeriod = {default "DAY", "WEEK", "MONTH"};
input length = 25;
input predictionLength = 0;

Assert(length > 0, "'length' should be positive: " + length);
Assert(predictionLength >= 0, "'prediction length' should be greater than or equal to 0: " + predictionLength);
Assert(predictionLength <= length, "'prediction length' should be less than or equal to 'length'");

def isEnd = !IsNaN(close(period = aggregationPeriod)[-length + predictionLength]) and IsNaN(close(period = aggregationPeriod)[-length + predictionLength - 1]);

def highValue = if isEnd then Highest(high(period = aggregationPeriod), length) else highValue[1];
def lowValue = if isEnd then Lowest(low(period = aggregationPeriod), length) else lowValue[1];
def closeValue = if isEnd then close(period = aggregationPeriod) else closeValue[1];

def show = !IsNaN(close(period = aggregationPeriod)[predictionLength]) and IsNaN(close(period = aggregationPeriod)[-length + predictionLength]);

def range = highValue - lowValue;

plot R5;
plot R4;
plot R3;
plot R2;
plot R1;
plot S1;
plot S2;
plot S3;
plot S4;
plot S5;

if !show
then {
    R5 = Double.NaN;
    R4 = Double.NaN;
    R3 = Double.NaN;
    R2 = Double.NaN;
    R1 = Double.NaN;
    S1 = Double.NaN;
    S2 = Double.NaN;
    S3 = Double.NaN;
    S4 = Double.NaN;
    S5 = Double.NaN;
} else {
    R5 = (highValue / lowValue) * closeValue;
    R4 = closeValue + range * (1.1) / 2;
    R3 = closeValue + range * (1.1) / 4;
    R2 = closeValue + range * (1.1) / 6;
    R1 = closeValue + range * (1.1) / 12;
    S1 = closeValue - range * (1.1) / 12;
    S2 = closeValue - range * (1.1) / 6;
    S3 = closeValue - range * (1.1) / 4;
    S4 = closeValue - range * (1.1) / 2;
    S5 = (closeValue - (R5 - closeValue));
}

R1.Hide();
S1.Hide();

R5.SetDefaultColor(GetColor(5));
R4.SetDefaultColor(GetColor(5));
R3.SetDefaultColor(GetColor(5));
R2.SetDefaultColor(GetColor(5));
R1.SetDefaultColor(GetColor(5));
S1.SetDefaultColor(GetColor(6));
S2.SetDefaultColor(GetColor(6));
S3.SetDefaultColor(GetColor(6));
S4.SetDefaultColor(GetColor(6));
S5.SetDefaultColor(GetColor(6));

def paintingStrategy = if aggregationPeriod == aggregationPeriod.DAY then PaintingStrategy.POINTS else if aggregationPeriod == aggregationPeriod.WEEK then PaintingStrategy.TRIANGLES else PaintingStrategy.SQUARES;

R5.SetPaintingStrategy(paintingStrategy);
R4.SetPaintingStrategy(paintingStrategy);
R3.SetPaintingStrategy(paintingStrategy);
R2.SetPaintingStrategy(paintingStrategy);
R1.SetPaintingStrategy(paintingStrategy);
S1.SetPaintingStrategy(paintingStrategy);
S2.SetPaintingStrategy(paintingStrategy);
S3.SetPaintingStrategy(paintingStrategy);
S4.SetPaintingStrategy(paintingStrategy);
S5.SetPaintingStrategy(paintingStrategy);
A sample thinkorswim chart is shown in Figure 3.
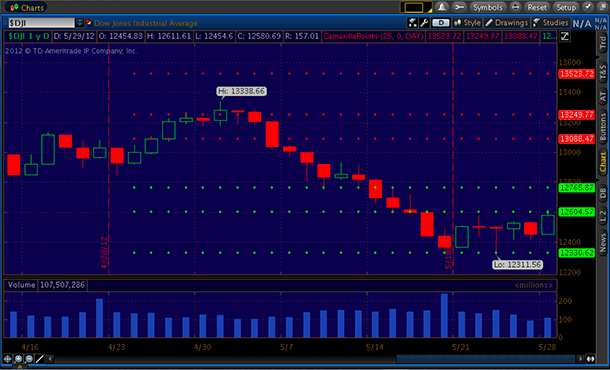
FIGURE 3: THINKORSWIM. Here, camarilla points are used as the basis for pivot points.

In this issue, Slawomir Bobrowski’s article puts the focus on a set of price pivot levels called camarilla points. In contrast to classic pivot points, they have the benefit of being closer together, thus providing more action to intraday traders.
Our rendition of the camarilla point idea requires intraday data. The support and resistance levels are determined using the previous trading session’s daily high, low, and close prices. However, trades are entered on an intraday basis and always closed at the end of trading session. In addition, we introduced a limit of a single trade per day to avoid whipsaws. It’s possible to choose any type of trade: inside S3/R3, outside S3/R3, and breakouts from S4/R4 levels. (See Figure 4.)
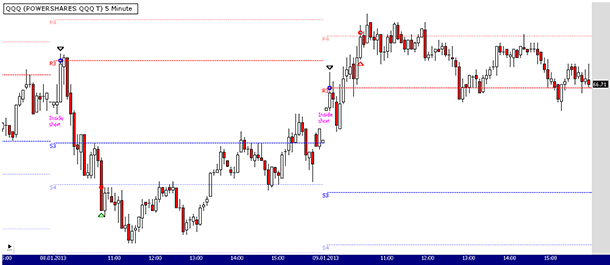
FIGURE 4: WEALTH-LAB. This five-minute chart of QQQ illustrates the application of the multi–time frame camarilla points breakout & reversion trading system. The two trades were signaled by the market opening inside S3/R3 thresholds.
The system’s unabridged C# code for Wealth-Lab is shown below.
C# Code:

using System;
using System.Collections.Generic;
using System.Text;
using System.Drawing;
using WealthLab;
using WealthLab.Indicators;

namespace WealthLab.Strategies
{
	/// <summary>
	/// Camarilla Point calculation
	/// </summary>
	public class Camarilla
	{
		#region Properties

		private double _r1;

		public double R1
		{
			get { return _r1;}
			set { _r1 = value;}
		}

		private double _r2;

		public double R2
		{
			get { return _r2;}
			set { _r2 = value;}
		}

		private double _r3;

		public double R3
		{
			get { return _r3;}
			set { _r3 = value;}
		}

		private double _r4;

		public double R4
		{
			get { return _r4;}
			set { _r4 = value;}
		}

		private double _r5;

		public double R5
		{
			get { return _r5;}
			set { _r5 = value;}
		}

		private double _s1;

		public double S1
		{
			get { return _s1;}
			set { _s1 = value;}
		}

		private double _s2;

		public double S2
		{
			get { return _s2;}
			set { _s2 = value;}
		}

		private double _s3;

		public double S3
		{
			get { return _s3;}
			set { _s3 = value;}
		}

		private double _s4;

		public double S4
		{
			get { return _s4;}
			set { _s4 = value;}
		}

		private double _s5;

		public double S5
		{
			get { return _s5;}
			set { _s5 = value;}
		}

		#endregion

		public Camarilla()
		{
			Clear();
		}

		public void FindPivotLevels( double high, double low, double close )
		{
			R1 = 0; R2 = 0; R3 = 0; R4 = 0; R5 = 0;
			S1 = 0; S2 = 0; S3 = 0; S4 = 0; S5 = 0;

			double Range = high - low;

			R5 = ( high / low ) * close;
			R4 = close + Range * 1.1 / 2;
			R3 = close + Range * 1.1 / 4;
			R2 = close + Range * 1.1 / 6;
			R1 = close + Range * 1.1 / 12;

			S1 = close - Range * 1.1 / 12;
			S2 = close - Range * 1.1 / 6;
			S3 = close - Range * 1.1 / 4;
			S4 = close - Range * 1.1 / 2;
			S5 = close - (R5 - close);
		}

		public void Clear()
		{
			R1 = 0; R2 = 0; R3 = 0; R4 = 0; R5 = 0;
			S1 = 0; S2 = 0; S3 = 0; S4 = 0; S5 = 0;
		}
	}

	public class CamarillaPointsStrategy : WealthScript
	{
		enum Entry { Inside, Outside, Breakout };

		private StrategyParameter paramEntryType;

		public CamarillaPointsStrategy()
		{
			paramEntryType = CreateParameter("In/Out/Brk", 0, 0, 2, 1);
		}

		protected override void Execute()
		{
			if ( !Bars.IsIntraday )
			{
				DrawLabel( PricePane, "For use on intraday data", Color.Red );
				Abort();
			}

			// Change scale to Daily
			HideVolume();
			SetScaleDaily();
			Bars dailyBars = Bars;
			DataSeries CompBar = new DataSeries(Bars, "Compressed Bar Numbers");
			for (int bar = 0; bar < Bars.Count; bar++)
				CompBar[bar] = bar;
			RestoreScale();
			dailyBars = Synchronize(dailyBars);
			DataSeries GetDailyBar = Synchronize(CompBar);

			// Initialize an instance of the CamarillaPoint class
			Camarilla c = new Camarilla();
			double tick = Bars.SymbolInfo.Tick;
			bool enterTrades = true;
			bool canTrade = true;
			Entry e = paramEntryType.ValueInt == 0 ? Entry.Inside : paramEntryType.ValueInt == 1 ? Entry.Outside : Entry.Breakout;

			// Main (trading) loop
			SetBarColors( Color.Silver, Color.DarkGray );
			for(int bar = 1; bar < Bars.Count; bar++)
			{
				#region Variables

				int dailyBar = (int)GetDailyBar[bar];
				int firstBarToday = bar - Bars.IntradayBarNumber(bar);
				double openToday = Open[firstBarToday];
				bool lastBarToday = Bars.IsLastBarOfDay( bar );
				if( ( bar == 1 || lastBarToday ) )
					canTrade = true;
				if( lastBarToday )
					enterTrades = false;

				#endregion

				#region Determine Camarilla Point levels

				if( firstBarToday > -1 )
				{
					if( Bars.IntradayBarNumber(bar) == 0 )
					{
						c.FindPivotLevels( dailyBars.High[bar], dailyBars.Low[bar], dailyBars.Close[bar] );
					}

					if( Bars.IsLastBarOfDay(bar) )
					{
						DrawLine( PricePane, bar, c.S3, firstBarToday, c.S3, Color.Blue, LineStyle.Dashed, 1 );
						DrawLine( PricePane, bar, c.R3, firstBarToday, c.R3, Color.Red, LineStyle.Dashed, 1 );
						DrawLine( PricePane, bar, c.S4, firstBarToday, c.S4, Color.FromArgb(100,Color.Blue), LineStyle.Dashed, 1 );
						DrawLine( PricePane, bar, c.R4, firstBarToday, c.R4, Color.FromArgb(100,Color.Red), LineStyle.Dashed, 1 );
						DrawLine( PricePane, bar, c.S5, firstBarToday, c.S5, Color.FromArgb(60,Color.Blue), LineStyle.Dashed, 1 );
						DrawLine( PricePane, bar, c.R5, firstBarToday, c.R5, Color.FromArgb(60,Color.Red), LineStyle.Dashed, 1 );

						AnnotateChart( PricePane, "S3", firstBarToday, c.S3, Color.Blue );
						AnnotateChart( PricePane, "R3", firstBarToday, c.R3, Color.Red );
						AnnotateChart( PricePane, "S4", firstBarToday, c.S4, Color.FromArgb(100,Color.Blue) );
						AnnotateChart( PricePane, "R4", firstBarToday, c.R4, Color.FromArgb(100,Color.Red) );
						AnnotateChart( PricePane, "S4", firstBarToday, c.S5, Color.FromArgb(60,Color.Blue) );
						AnnotateChart( PricePane, "R4", firstBarToday, c.R5, Color.FromArgb(60,Color.Red) );
					}
				}

				#endregion

				if (IsLastPositionActive)
				{
					Position p = LastPosition;
					if( lastBarToday )
						ExitAtClose(bar, p, "At Close");
					else
						if( !ExitAtStop( bar+1, p, p.RiskStopLevel, "Risk stop" ) )
						ExitAtLimit( bar+1, p, p.AutoProfitLevel, "Profit" );
				}
				else
				{
					if( !enterTrades && canTrade && firstBarToday > 0 && !lastBarToday)
					{
						bool openInsideS3R3 = openToday > c.S3 && openToday < c.R3;
						bool openOutsideS3R3 = openToday < c.S3 || openToday > c.R3;
						bool openBetweenR3R4 = openToday > c.R3 && openToday < c.R4;
						bool openBetweenS3S4 = openToday < c.S3 && openToday > c.S4;

						enterTrades = ( !lastBarToday &&
							( (e == Entry.Inside) && openInsideS3R3 ) ||
							( (e == Entry.Outside) && openOutsideS3R3 ) ||
							( (e == Entry.Breakout) && (openBetweenR3R4 || openBetweenS3S4) ) );
					}

					if( enterTrades && dailyBar > 1 && firstBarToday > 0 && !lastBarToday )
					{
						if( e == Entry.Outside )
						{
							#region Outside S3/R3

							if( openToday < c.S3 )
							{
								if( BuyAtStop( bar + 1, c.S3, "Outside S3/R3" ) != null )
								{
									AnnotateBar( "Outside\nbuy", bar, false, Color.Magenta );
									LastPosition.RiskStopLevel = c.S4 - tick;
									LastPosition.AutoProfitLevel = c.R3 + tick;
									enterTrades = false;
									canTrade = false;
								}
							}
							else
								if( openToday > c.R3 )
							{
								if( ShortAtStop( bar + 1, c.R3, "Outside S3/R3" ) != null )
								{
									AnnotateBar( "Outside\nshort", bar, false, Color.Magenta );
									LastPosition.RiskStopLevel = c.R4 + tick;
									LastPosition.AutoProfitLevel = c.S3 - tick;
									enterTrades = false;
									canTrade = false;
								}
							}

							#endregion
						}
						else
						if( e == Entry.Inside )
						{
							#region Inside S3/R3

							if( BuyAtLimit( bar + 1, c.S3, "Inside S3/R3" ) != null )
							{
								AnnotateBar( "Inside\nbuy", bar, false, Color.Magenta );
								LastPosition.RiskStopLevel = c.S4 - tick;
								LastPosition.AutoProfitLevel = c.R4 + tick;
								enterTrades = false;
								canTrade = false;
							}
							else
								if( ShortAtLimit( bar + 1, c.R3, "Inside S3/R3" ) != null )
							{
								AnnotateBar( "Inside\nshort", bar, false, Color.Magenta );
								LastPosition.RiskStopLevel = c.R4 + tick;
								LastPosition.AutoProfitLevel = c.S4 - tick;
								enterTrades = false;
								canTrade = false;
							}

							#endregion
						}
						else
						if( e == Entry.Breakout )
						{
							#region Breakout from S4/R4

							if( BuyAtStop( bar + 1, c.R4, "Breakout R4" ) != null )
							{
								AnnotateBar( "Breakout\nbuy", bar, false, Color.Magenta );
								LastPosition.RiskStopLevel = c.R3 - tick;
								LastPosition.AutoProfitLevel = c.R5 + tick;
								enterTrades = false;
								canTrade = false;
							}
							else
								if( ShortAtStop( bar + 1, c.S4, "Breakout S4" ) != null )
							{
								AnnotateBar( "Breakout\nshort", bar, false, Color.Magenta );
								LastPosition.RiskStopLevel = c.S3 + tick;
								LastPosition.AutoProfitLevel = c.R5 - tick;
								enterTrades = false;
								canTrade = false;
							}

							#endregion
						}
					}
				}
			}
		}
	}
}
On a closing note, motivated traders may also want to explore “Woodie’s pivots.” These differ from the rest of the breed (that is, floor trader pivots, camarilla points, or Fibonacci pivots) in that they introduce today’s open price into the formula.

In “Camarilla Points” in this issue, author Slawomir Bobrowski presents a simple pivot trading technique.
A ready-to-use formula for the indicator is given here. To display the indicator, simply input the formula into the Formula Editor and press “Apply indicator.” To adjust the number of periods, click the right mouse button and choose “parameters” from the menu. The camarilla points are calculated based on prices from a given number of bars prior to the selected date. To change the selected date, simply click on any bar.
AMIBROKER CODE LISTING

Period = Param("Period", 25, 2, 100 );
bi = BarIndex();

procedure PlotLevel( array, nam, Color )
{
 x = SelectedValue( bi );
 y = SelectedValue( array );
 Plot( IIf( bi >= x AND bi < x + Period, y, Null ),
       nam, Color, styleDashed );
 PlotText( nam, x + Period - 1, y, Color );
}

pl = Ref( LLV( Low, Period ), -1 );
ph = Ref( HHV( High, Period ), -1 );
range = ph - pl;
pc = Ref( Close, -1 );
R5 = ph/pl * pc;
R4 = pc + Range * 1.1/2;
R3 = pc + Range * 1.1/4;
R2 = pc + Range * 1.1/6;
R1 = pc + Range * 1.1/12;

S1 = pc - Range * 1.1/12;
S2 = pc - Range * 1.1/6;
S3 = pc - Range * 1.1/4;
S4 = pc - Range * 1.1/2;
S5 = pc - ( R5 - pc );


Plot( C, Name() + " " + Date(), colorDefault, styleCandle );

PlotLevel( R5, "R5", colorBlue );
PlotLevel( R4, "R4", colorBlue );
PlotLevel( R3, "R3", colorBlue );
//PlotLevel( R2, "R2", colorBlue );
//PlotLevel( R1, "R1", colorBlue );
//PlotLevel( S1, "S1", colorRed );
//PlotLevel( S2, "S2", colorRed );
PlotLevel( S3, "S3", colorRed );
PlotLevel( S4, "S4", colorRed );
PlotLevel( S5, "S5", colorRed );
A sample chart is shown in Figure 5.
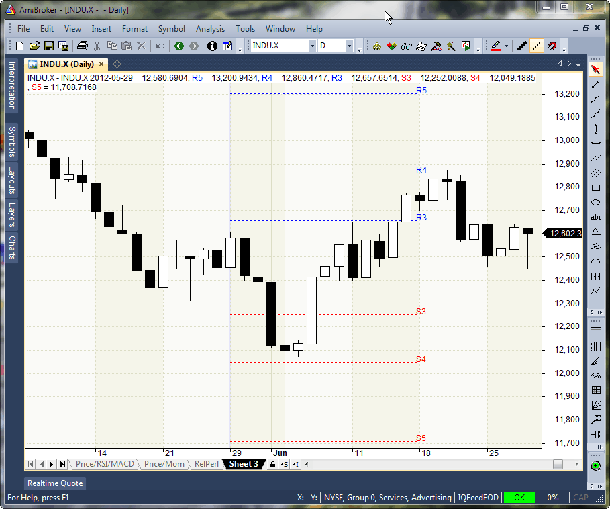
FIGURE 5: AMIBROKER. Here is a sample chart showing camarilla points (15-day time frame: May 29–June 19, 2012).

Camarilla points, as described by Slawomir Bobrowski in his article in this issue of the same name, can be easily implemented with a few of NeuroShell Trader’s 800+ indicators. Simply select “New indicator” from the Insert menu and use the Indicator Wizard to set up the following indicators:
Daily, Weekly or Monthly Charts:

R5:	Multiply2( Divide( High, Low ), Close )
R4:	Add2( Close, Multiply2( Range( High, Low, 1), Divide( 1.1, 2 ) )
R3:	Add2( Close, Multiply2( Range( High, Low, 1), Divide( 1.1, 4 ) )
R2:	Add2( Close, Multiply2( Range( High, Low, 1), Divide( 1.1, 6 ) )
R1:	Add2( Close, Multiply2( Range( High, Low, 1), Divide( 1.1, 12 ) )

S1:	Subtract( Close, Multiply2( Range( High, Low, 1), Divide( 1.1, 12 ) )
S2:	Subtract( Close, Multiply2( Range( High, Low, 1), Divide( 1.1, 6 ) )
S3:	Subtract( Close, Multiply2( Range( High, Low, 1), Divide( 1.1, 4 ) )
S4:	Subtract( Close, Multiply2( Range( High, Low, 1), Divide( 1.1, 2 ) )
S5:	Subtract( Close, Subtract( R5, Close ))

Intraday Charts:

R5:	Multiply2( Divide( DayHigh(Date,High,1), DayLow(Date,Low,1) ), DayClose(Date,Close,1) )
R4:	Add2( DayClose(Date, Close, 1), Multiply2( DayRange( High, Low, 1), Divide( 1.1, 2 ) )
R3:	Add2( DayClose(Date, Close, 1), Multiply2( DayRange( High, Low, 1), Divide( 1.1, 4 ) )
R2:	Add2( DayClose(Date, Close, 1), Multiply2( DayRange( High, Low, 1), Divide( 1.1, 6 ) )
R1:	Add2( DayClose(Date, Close, 1), Multiply2( DayRange( High, Low, 1), Divide( 1.1, 12 ) )

S1:	Subtract( DayClose(Date, Close, 1), Multiply2( DayRange( High, Low, 1), Divide( 1.1, 12 ) )
S2:	Subtract( DayClose(Date, Close, 1), Multiply2( DayRange( High, Low, 1), Divide( 1.1, 6 ) )
S3:	Subtract( DayClose(Date, Close, 1), Multiply2( DayRange( High, Low, 1), Divide( 1.1, 4 ) )
S4:	Subtract( DayClose(Date, Close, 1), Multiply2( DayRange( High, Low, 1), Divide( 1.1, 2 ) )
S5:	Subtract( DayClose(Date, Close, 1), Subtract( R5, DayClose(Date, Close, 1) ))
Users of NeuroShell Trader can go to the Stocks & Commodities section of the NeuroShell Trader free technical support website to download a copy of this or any previous Traders’ Tips.
A sample chart is shown in Figure 6.
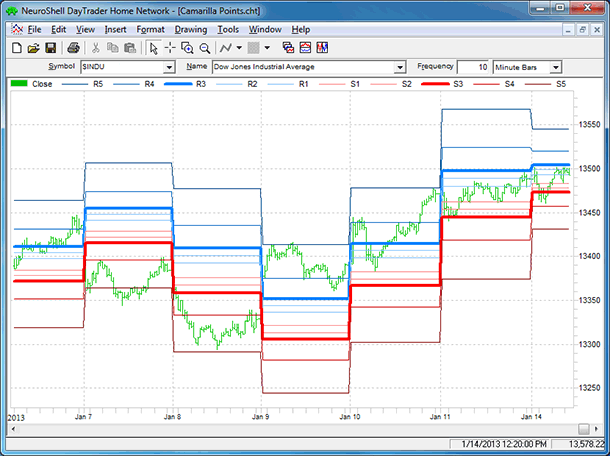
FIGURE 6: NEUROSHELL TRADER. This NeuroShell Trader chart displays camarilla points on an intraday chart.

The AIQ code based on Slawomir Bobrowski’s article in this issue, “Camarilla Points,” is provided at www.TradersEdgeSystems.com/traderstips.htm and is shown below.
The camarilla point levels are dependent on both the time frame and the starting point. As for how to determine where to start the analysis, Bobrowski indicated that this question was beyond the scope of this month’s article and that he would cover this in a future article in S&C.
In the AIQ code I am offering here, I provide for inputs that allow the user to set the start date of the analysis and also the length of the time frame. Each of the 10 camarilla points can be added as custom single line indicators on the upper portion of the chart. Each can then be clicked on or off separately, and one or more of the levels can be shown on the chart.
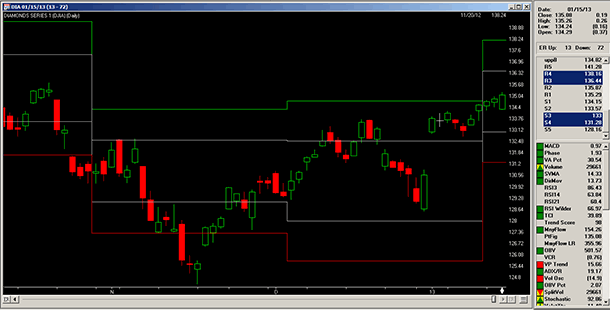
FIGURE 7: AIQ. This sample AIQ charts displays four sets of camarilla points (R4-green, R3-white, S3-white, and S4-red) on a chart of the DIA ETF using a 25-bar time frame and a starting date of 1/14/2011.
In Figure 7, I show the R4, R3, S3, S4 levels on a chart of DIA. The time frame interval was set to 25 and the start date was set to 1/14/2011. The code provided allows for a backtest of the first support and resistance system described by Bobrowski under the subheading “Market opens inside S3–R3.”
!CAMARILLA POINTS
!Author: Slawomir Bobrowski, TASC March 2013
!Coded by: Richard Denning 1/11/2013
!www.TradersEdgeSystems.com

!INPUTS:
StartMonth is 01.
StartDay is 14.
StartYear is 2011.
TimeFrame is 25.
Symbol is "DIA".

!ABREVIATIONS:
C is [close].
H is [high].
L is [low].
O is [open].
OSD is offsettodate(month(),day(),year()).
BarsHeld is {position days}.

!INDICATOR RULES AND UDFs:
StartDate if month()=StartMonth and day()=StartDay and year()=StartYear.
DaysToStart is scanany(StartDate,252*10) then OSD.
DaysToStartSPX is tickerUDF("SPX",DaysToStart) then OSD.
NumOfIntervals is floor(^DaysToStart / (TimeFrame)).

LastModDate is setdate(DaysToStart-NumOfIntervals*TimeFrame).
LastModOS is ^DaysToStart-NumOfIntervals*TimeFrame.
LastAnchorOS is iff(LastModOS > TimeFrame-1,LastModOS-(TimeFrame-1),LastModOS).
LastAnchorDate is setdate(LastAnchorOS).

HH is highresult(H,TimeFrame,LastAnchorOS).
LL is lowresult(L,TimeFrame,LastAnchorOS).
AnchorC is valresult(C,LastAnchorOS).
Range is HH - LL.
R5 is (HH/LL)*AnchorC.
R4 is AnchorC + Range * (1.1)/2.
R3 is AnchorC + Range * (1.1)/4.
R2 is AnchorC + Range * (1.1)/6.
R1 is AnchorC + Range * (1.1)/12.
S1 is AnchorC - Range * (1.1)/12.
S2 is AnchorC - Range * (1.1)/6.
S3 is AnchorC - Range * (1.1)/4.
S4 is AnchorC - Range * (1.1)/2.
S5 is AnchorC - (R5-AnchorC).

BaseDate is setdate((TimeFrame)+LastAnchorOS).
ShowValues if Symbol()=Symbol.
FirstOpen is valresult(O,LastAnchorOS-1).

!SYSTEM RULES FOR "MARKET OPENS INSIDE S3 - R3":
Buy if  Symbol()=Symbol and FirstOpen < R3 and FirstOpen > S3 and L < S3 and LastAnchorOS > 1.
BuyPrice is max(O,S3).
ExitBuy if L < S4 or (H > R3 and valrule(H < R3,1)) or BarsHeld >= TimeFrame.
ExitBuyPrice is iff(L < S4,S4-0.01,iff(H > R3 and valrule(H < R3,1),R3,-99)).

Sell if FirstOpen < R3 and FirstOpen > S3 and H > R3 and LastAnchorOS > 1.
SellPrice is min(O,R3).
ExitSell if H > R4 or (L < S3 and valrule(L > S3,1)) or BarsHeld >= TimeFrame.
ExitSellPrice is iff(H > R4,R4+0.01,iff(L < S3 and valrule(L > S3,1),S3,-99)).
The code and EDS file can be downloaded from www.TradersEdgeSystems.com/traderstips.htm.

The TradersStudio code based on Slawomir Bobrowski’s article in this issue, “Camarilla Points,” is provided at the following websites:
The code is also available below.
The following code files are provided in the download:
I set up a test session using the SP futures contract (with data from Pinnacle Data). In Figure 8, I show the equity curve and underwater equity curve trading one contract from 1982 to 2013.
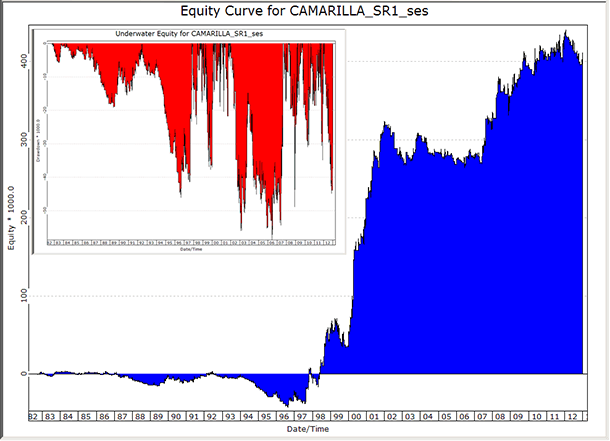
FIGURE 8: TRADERSSTUDIO. Here are sample equity and underwater equity curves for the SR1 system trading one SP contract from 1982 through 2013.
'Author: Slawomir Bobrowski, TASC March 2013
'Coded by: Richard Denning 1/11/2013
'www.TradersEdgeSystems.com

'INPUTS:
'StartMonth is 04.  '04
'StartDay is 16.    '16
'StartYear is 2010. '2002
'Frame is 25.
'StartDate if month()=StartMonth and day()=StartDay and year()=StartYear.
'Symbol is "DIA".

Function CAMARILLA_POINT(Frame,Type,Level,LastAnchorOS)
'Type 1 = support
'Type 2 = resistance
Dim HH,LL,theRange,Point
Dim AnchorC As BarArray
HH = Highest(H,Frame,LastAnchorOS)
LL = Lowest(L,Frame,LastAnchorOS)
AnchorC = C[LastAnchorOS]
theRange = HH - LL
If (Type = 2) Then
    If (Level = 5) Then Point = (HH/LL)*AnchorC 'R5
    If (Level = 4) Then Point = AnchorC + theRange * (1.1)/2 'R4
    If (Level = 3) Then Point = AnchorC + theRange * (1.1)/4 'R3
    If (Level = 2) Then Point = AnchorC + theRange * (1.1)/6 'R2
    If (Level = 1) Then Point = AnchorC + theRange * (1.1)/12 'R1
End If
If (Type = 1) Then
    If (Level = 1) Then Point = AnchorC - theRange * (1.1)/12 'S1
    If (Level = 2) Then Point = AnchorC - theRange * (1.1)/6  'S2
    If (Level = 3) Then Point = AnchorC - theRange * (1.1)/4  'S3
    If (Level = 4) Then Point = AnchorC - theRange * (1.1)/2  'S4
    If (Level = 5) Then Point = AnchorC - ((HH/LL)*AnchorC-AnchorC) 'S5
End If
CAMARILLA_POINT = Point
End Function
'------------------------------------------------------------------------
'INDICATOR PLOT:
Sub CAMARILLA_SR1_IND(Frame)
Dim BarsToStart, BarsToLastComp, S1,S2,S3,S4,S5,R1,R2,R3,R4,R5
Dim NumOfIntervals As BarArray

BarsToStart = BarNumber - Frame - 1
NumOfIntervals = Round(((BarNumber-1) / Frame) - 0.5 ,0)
BarsToLastComp = BarsToStart - (NumOfIntervals-1)*Frame
If BarNumber > BarSize*2+1 Then
    S1 = Round(CAMARILLA_POINT(Frame,1,1,BarsToLastComp),2)
    S2 = Round(CAMARILLA_POINT(Frame,1,2,BarsToLastComp),2)
    S3 = Round(CAMARILLA_POINT(Frame,1,3,BarsToLastComp),2)
    S4 = Round(CAMARILLA_POINT(Frame,1,4,BarsToLastComp),2)
    S5 = Round(CAMARILLA_POINT(Frame,1,5,BarsToLastComp),2)
    R1 = Round(CAMARILLA_POINT(Frame,2,1,BarsToLastComp),2)
    R2 = Round(CAMARILLA_POINT(Frame,2,2,BarsToLastComp),2)
    R3 = Round(CAMARILLA_POINT(Frame,2,3,BarsToLastComp),2)
    R4 = Round(CAMARILLA_POINT(Frame,2,4,BarsToLastComp),2)
    R5 = Round(CAMARILLA_POINT(Frame,2,5,BarsToLastComp),2)
End If
plot1(R4)
plot2(R3)
plot3(S3)
plot4(S4)
End Sub
'-------------------------------------------------------------------------
'SYSTEM "MARKET OPENS BETWEEN S3 - R3":
Sub CAMARILLA_SR1(Frame)
Dim BarsToStart,BarsToLastComp,S1,S2,S3,S4,S5,R1,R2,R3,R4,R5,FirstOpen
Dim NumOfIntervals As BarArray

BarsToStart = BarNumber - Frame - 1
NumOfIntervals = Round(((BarNumber-1) / Frame) - 0.5 ,0)
BarsToLastComp = BarsToStart - (NumOfIntervals-1)*Frame
If BarNumber > BarSize*2+1 Then
    S1 = Round(CAMARILLA_POINT(Frame,1,1,BarsToLastComp),2)
    S2 = Round(CAMARILLA_POINT(Frame,1,2,BarsToLastComp),2)
    S3 = Round(CAMARILLA_POINT(Frame,1,3,BarsToLastComp),2)
    S4 = Round(CAMARILLA_POINT(Frame,1,4,BarsToLastComp),2)
    S5 = Round(CAMARILLA_POINT(Frame,1,5,BarsToLastComp),2)
    R1 = Round(CAMARILLA_POINT(Frame,2,1,BarsToLastComp),2)
    R2 = Round(CAMARILLA_POINT(Frame,2,2,BarsToLastComp),2)
    R3 = Round(CAMARILLA_POINT(Frame,2,3,BarsToLastComp),2)
    R4 = Round(CAMARILLA_POINT(Frame,2,4,BarsToLastComp),2)
    R5 = Round(CAMARILLA_POINT(Frame,2,5,BarsToLastComp),2)
End If
'If BarNumber >= LastBar-Frame*2 Then Print FormatDateTime(Date)," ",NumOfIntervals," ",BarsToLastComp," ",R5," ",R4," ",R3," ",R2," ",R1," ",S1," ",S2," ",S3," ",S4," ",S5," "
If BarsToLastComp >= 1 Then FirstOpen = O[BarsToLastComp-1]
If FirstOpen < R3 And FirstOpen > S3 And BarsToLastComp > 1 Then
    If  CrossesUnder(C,S3) Then Buy("LE",1,0,Market,Day)
    If L < S4 Then ExitLong("LX_SL","",1,0,Market,Day)
    If CrossesOver(H,R3) Then ExitLong("LX_PT","",1,0,Market,Day)
    If BarsSinceEntry >= BarsToLastComp - 1 Then ExitLong("LX_Time","",1,0,Market,Day)
    If CrossesOver(C,R3) Then Sell("SE",1,0,Market,Day)
    If H > R4 Then ExitShort("SX_SL","",1,0,Market,Day)
    If CrossesUnder(L,S3) Then ExitShort("SX_PT","",1,0,Market,Day)
    If BarsSinceEntry >= BarsToLastComp - 1 Then ExitShort("SX_Time","",1,0,Market,Day)
End If
End Sub

We have implemented a camarilla points indicator and strategy based on Slawomir Bobrowski’s article in this issue, “Camarilla Points.” This automated strategy and indicator are available for download at www.ninjatrader.com/SC/March2013SC.zip.
Once they have been downloaded, from within the NinjaTrader Control Center window, select the menu File → Utilities → Import NinjaScript and select the downloaded file. This file is for NinjaTrader version 7 or greater.
You can review the strategy source code by selecting the menu Tools → Edit NinjaScript → Strategy from within the NinjaTrader Control Center window and selecting “Camarilla-PointsATS.”
You can review the indicator source code by selecting the menu Tools → Edit NinjaScript → Indicator from within the NinjaTrader Control Center window and selecting “Camarilla-Points.”
A sample chart implementing NinjaTrader’s CamarillaPoints strategy is shown in Figure 9.
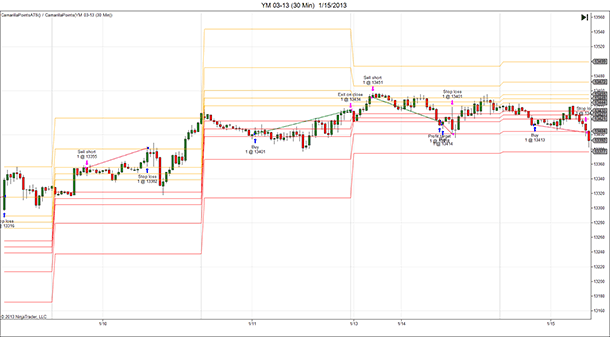
FIGURE 9: NINJATRADER. The NinjaTrader screenshot shows the camarillaPoints indicator and strategy applied to a 30-minute chart of Dow Jones futures (YM 03-13).

In In his article in this issue, “Camarilla Points,” author Slawomir Bobrowski delivers a trading system to exploit market fluctuations around a point of balance derived from multiple time frames, not just daily OHLC prices used in traditional pivots, which pit traders are said to have used. Eight basic points are calculated from session high, session low, and session close formula inputs, and these can be used as entry & exit levels for short-term range trades (Figure 10).
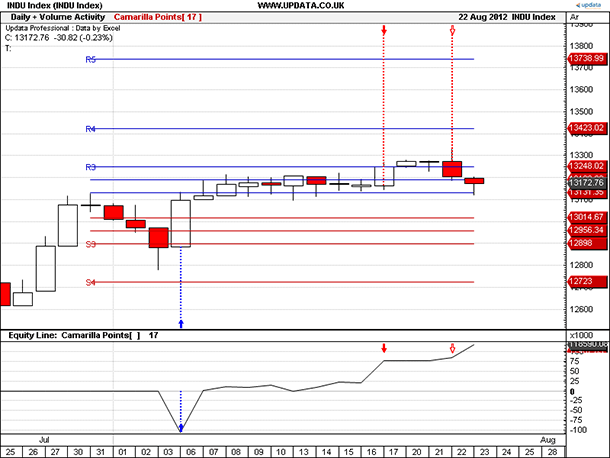
FIGURE 10: UPDATA, CAMARILLA. This chart shows the daily DJIA with a long entry at S3 followed by an R3 exit. An R3 short entry is shown remaining open, with a profit target exit of S3.
The Updata code for this indicator has been added to the Updata Library and may be downloaded by clicking the “custom” menu and then “system library.” Those who cannot access the library due to a firewall may paste the code provided here into the Updata custom editor and save it.
'Camarilla Points
PARAMETER "Period" #PERIOD=50
DISPLAYSTYLE LINE
INDICATORTYPE TOOL
NAME "Camarilla Points[" #PERIOD "]" ""
NUMPOSITIONS 2
@RANGE=0
@S1=0
@S2=0
@S3=0
@S4=0
@S5=0
@R1=0
@R2=0
@R3=0
@R4=0
@R5=0
FOR #CURDATE=#LASTDATE-(#PERIOD) TO #LASTDATE
   'R3 & S3 REVERSAL
   IF HASX(CLOSE,@R3,UP) AND ORDERISOPEN=1
      SELL CLOSE
   ENDIF
   IF HASX(CLOSE,@S3,UP)
      COVER CLOSE
      BUY CLOSE
   ENDIF
   IF HASX(CLOSE,@R3,DOWN) AND ORDERISOPEN=-1
      COVER CLOSE
   ENDIF
   IF HASX(CLOSE,@R3,DOWN)
      'EXIT IF LONG AN CROSSES DOWN THROUGH R3 LEVEL
      SELL CLOSE
      SHORT CLOSE
   ENDIF
   'S4 BREAKOUTS
   IF HASX(CLOSE,@S4,DOWN)
      SHORT CLOSE
   ENDIF
   IF HASX(CLOSE,@S5,DOWN)
      COVER CLOSE
   ENDIF
   'R4 BREAKOUTS
   IF HASX(CLOSE,@R4,UP)
      BUY CLOSE
   ENDIF
   IF HASX(CLOSE,@R5,UP)
      SELL CLOSE
   ENDIF
   'S5 REVERSALS
   IF HASX(CLOSE,@R5,UP)
      BUY CLOSE
   ENDIF
   IF HASX(CLOSE,@S4,UP) AND ORDERISOPEN=1
      SELL CLOSE
   ENDIF
   'R5 REVERSALS
   IF HASX(CLOSE,@R5,DOWN)
      SHORT CLOSE
   ENDIF
   IF HASX(CLOSE,@R4,DOWN) AND ORDERISOPEN=-1
      COVER CLOSE
   ENDIF
   If #CURDATE=#LASTDATE-(#PERIOD)
      'CAMARILLA POINTS
      @RANGE=PHIGH(HIGH,#PERIOD)-PLOW(LOW,#PERIOD)
      @R1=CLOSE+@RANGE*(1.1/12)
      @R2=CLOSE+@RANGE*(1.1/6)
      @R3=CLOSE+@RANGE*(1.1/4)
      @R4=CLOSE+@RANGE*(1.1/2)
      @R5=CLOSE*(PHIGH(HIGH,#PERIOD)/PLOW(LOW,#PERIOD))
      @S1=CLOSE-@RANGE*(1.1/12)
      @S2=CLOSE-@RANGE*(1.1/6)
      @S3=CLOSE-@RANGE*(1.1/4)
      @S4=CLOSE-@RANGE*(1.1/2)
      @S5=2*CLOSE-@R5
      COLOUR RGB(0,0,200)
      DRAWLINE 0,@R1,-#PERIOD,@R1
      DRAWLINE 0,@R2,-#PERIOD,@R2
      DRAWLINE 0,@R3,-#PERIOD,@R3
      DRAWLINE 0,@R4,-#PERIOD,@R4
      DRAWLINE 0,@R5,-#PERIOD,@R5
      DRAWTEXT @R3 AT "R3"
      DRAWTEXT @R4 AT "R4"
      DRAWTEXT @R5 AT "R5"
      COLOUR RGB(200,0,0)
      DRAWLINE 0,@S1,-#PERIOD,@S1
      DRAWLINE 0,@S2,-#PERIOD,@S2
      DRAWLINE 0,@S3,-#PERIOD,@S3
      DRAWLINE 0,@S4,-#PERIOD,@S4
      DRAWLINE 0,@S5,-#PERIOD,@S5
      DRAWTEXT @S3 AT "S3"
      DRAWTEXT @S4 AT "S4"
      DRAWTEXT @S5 AT "S5"
   EndIf
NEXT

In his article in this issue, “Camarilla Points,” author Slawomir Bobrowski describes camarilla points as being similar to pivot points and explains that camarilla points are eight levels around which market prices fluctuate — four levels of resistance and four levels of support; fifth levels of resistance & support have been added to handle breakouts. Bobrowski mentions that camarilla points are best suited for range trading and goes on to outline several different trading methods, with examples, based on the application of these levels.
We’ll be offering a camarilla points indicator for download in our VT client forums at https://forum.vtsystems.com along with hundreds of other precoded and free indicators and trading systems. The VT Trader instructions for creating the aforementioned indicator are as follows:
Camarilla Points
Name: TASC - 03/2013 - Camarilla Points - 24Hr Cycle
Function Name Alias: tasc_CamPoints
Label Mask:
TASC - 03/2013 -Camarilla Points - 24Hr Cycle (Calculation Time: %CalculationHour%:%CalculationMinute%)
R1 = %Resistance1%, R2 = %Resistance2%, R3 = %Resistance3%, R4 = %Resistance4%, R5 = %Resistance5%
S1 = %Support1%, S2 = %Support2%, S3 = %Support3%, S4 = %Support4%, S5 = %Support5%
Placement: Price Frame
Data Inspection Alias: Camarilla Points - 24-Hr Cycle
[New] button...
Name: CalculationHour
Display Name: Calculation Hour
Type: integer
Default: 17

[New] button...
Name: CalculationMinute
Display Name: Calculation Minute
Type: integer
Default: 0
[New] button...
Var Name: Resistance5
Name: (R5)
Line Color: light blue
Line Width: 1
Line Type: solid line

[New] button...
Var Name: Resistance4
Name: (R4)
Line Color: light blue
Line Width: 1
Line Type: solid line

[New] button...
Var Name: Resistance3
Name: (R5)
Line Color: blue
Line Width: 1
Line Type: solid line

[New] button...
Var Name: Resistance2
Name: (R5)
Line Color: dark blue
Line Width: 1
Line Type: solid line

[New] button...
Var Name: Resistance1
Name: (R5)
Line Color: dark blue
Line Width: 1
Line Type: solid line

[New] button...
Var Name: Support1
Name: (S1)
Line Color: dark red
Line Width: 1
Line Type: solid line

[New] button...
Var Name: Support2
Name: (S2)
Line Color: dark red
Line Width: 1
Line Type: solid line

[New] button...
Var Name: Support3
Name: (S3)
Line Color: red
Line Width: 1
Line Type: solid line

[New] button...
Var Name: Support4
Name: (S4)
Line Color: light red
Line Width: 1
Line Type: solid line

[New] button...
Var Name: Support5
Name: (S5)
Line Color: light red
Line Width: 1
Line Type: solid line
{Provided By: Visual Trading Systems, LLC}
{Copyright: 2013}
{Description: TASC, March 2013 - "Trading In Multiple Time Frames, Camarilla Points" by Slawomir Bobrowski}
{File: tasc_CamPoints.vtscr - Version 1.0}

_Hour:= Hour();
_Minute:= Minute();

CalculationTime:= Cross((_Hour=CalculationHour AND _Minute>=CalculationMinute),0.5);

CalculateLookBackPeriods:= Barssince(CalculationTime=1);
LookBackPeriods:= valuewhen(1, Cross(0.5,CalculateLookBackperiods), ref(CalculateLookBackPeriods,-1)+1);

_H:= valuewhen(1,CalculationTime=1,HHV(H,LookBackPeriods));
_L:= valuewhen(1,CalculationTime=1,LLV(L,LookBackPeriods));
_C:= valuewhen(1,CalculationTime=1,C);
_Range:= _H-_L;

Resistance1:= _C + _Range * (1.1)/12;
Resistance2:= _C + _Range * (1.1)/6;
Resistance3:= _C + _Range * (1.1)/4;
Resistance4:= _C + _Range * (1.1)/2;
Resistance5:= (_H/_L) * _C;

Support1:= _C - _Range * (1.1)/12;
Support2:= _C - _Range * (1.1)/6;
Support3:= _C - _Range * (1.1)/4;
Support4:= _C - _Range * (1.1)/2;
Support5:= (_C-(Resistance5-_C));To attach the indicator to a chart, click the right mouse button within the chart window and then select “Add Indicator” → “TASC - 03/2013 - Camarilla Points - 24Hr Cycle” from the indicator list.
A sample chart is shown in Figure 11.
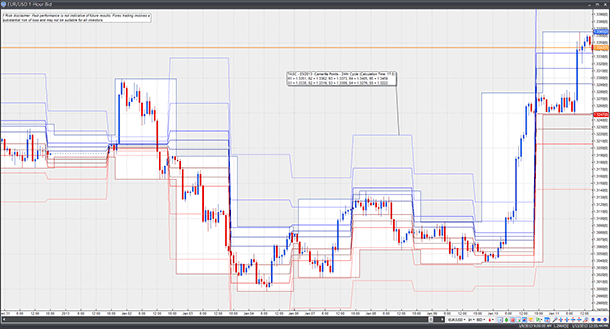
FIGURE 11: VT TRADER. Here, the camarilla points indicator is shown on a EUR/USD one-hour candlestick chart.
To learn more about VT Trader, visit www.vtsystems.com.
Risk disclaimer: Past performance is not indicative of future results. Forex trading involves a substantial risk of loss and may not be suitable for all investors.

In this issue, Slawomir Bobrowski presents his article, “Camarilla Points.”
Camarilla points may be used to identify price levels to enter and exit trades in the direction of the prevailing trend. One way to identify the trend is by using the MACD (moving average convergence/divergence) indicator, which in its simplest form may be expressed as the difference between two moving averages. If price moves sideways over time, the averages tend toward the same level, converging. As price moves strongly up or down, the averages diverge as the shorter time frame average moves away from the longer one in the direction of the price change.
The MACD camarilla trend system uses this simple conceptualization of MACD as the trend indicator, and employs camarilla points to time entries and exits in the direction of the trend. Here, we will look at the system applied to a portfolio of stocks consisting of just over 100 markets that come shipped with Trading Blox as sample data. Since we are trading stocks, we will keep things simple and trade long only, as it can be difficult or impossible to short some issues.
To start, let’s take a look at the MACD as a trend indicator. The difference between a faster and slower exponential moving average yields a positive number if the faster average is above the slower one and a negative number if the slower one is above the faster one. When the moving averages are at the same level, MACD is zero. When MACD is positive we can presume that the trend is up, and when it is negative, we can assume the trend is down (Figure 12).
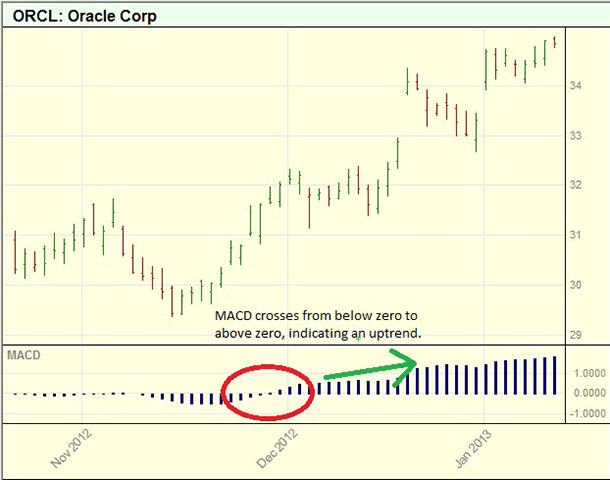
Figure 12: TRADING BLOX, MACD. Here, the MACD crosses above zero. This is the type of condition we want to look for in order to permit a long trade.
Once an uptrend is indicated by MACD, we place a stop order to go long the market at the R3 camarilla point. This forces the market to rise further and confirm the trend in order to trigger a position. Once a long position is taken, the S4 camarilla point serves as a stop-loss or trailing exit, and a stop order to liquidate the position is placed at that level. In addition, if MACD crosses below zero indicating that the uptrend is no longer in place, the trade is exited on the next open (Figure 13).
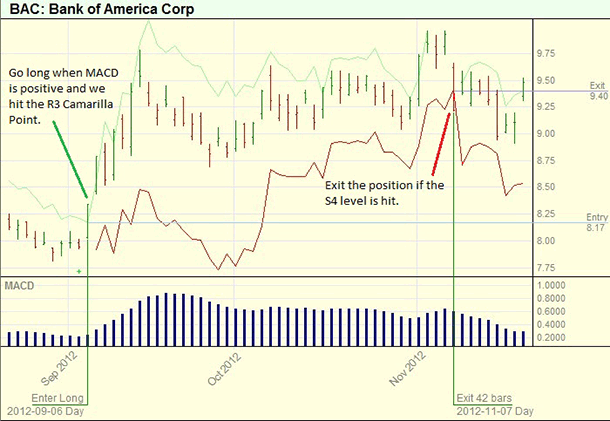
FIGURE 13: TRADING BLOX, CAMARILLA SYSTEM. The light green line above price represents the R3 camarilla point for each bar and the red line below price is the S4 level. This trade goes long as price crosses R3 with MACD > 0 and exits when price touches S4.
Trading Blox’s built-in Fixed Fractional Money Manager is used to size each trade. This money manager sizes positions based on a percentage of simulated account value and the distance from trade entry to the stop-loss or exit point. For example, a $100,000 account that is set to risk 1% of account equity per trade has a $1,000 per trade risk budget. If a position is indicated with an entry at $10 and a stop-loss at $8, then each share represents $2 worth of risk. In this case, the $1,000 risk budget indicates a position size of 500 shares ($1,000 budget divided by $2 risk per share).
Once the system is defined, Trading Blox allows the user to test any number of choices for the various parameters such as the moving average period or camarilla point time frame (Figure 14).
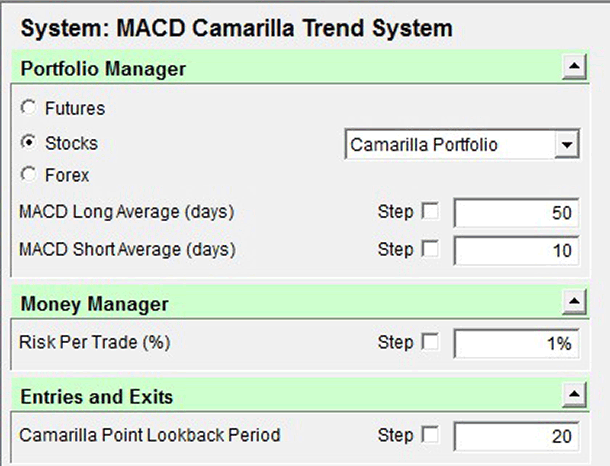
FIGURE 14: TRADING BLOX, SYSTEM PARAMETERS. The system contains four parameters that can be changed at will or stepped across a range of values by the user. In this example, we have an MACD employing 10- and 50-day moving averages, a camarilla lookback of 20 bars, and a risk per trade of 1%.
In simulated trading since the year 2000, this particular parameter set for the camarilla trend system returns the results shown in Figure 15. While this version of the system does make money over time, an exploration of the parameter space might reveal a lower-risk, higher-return alternative.
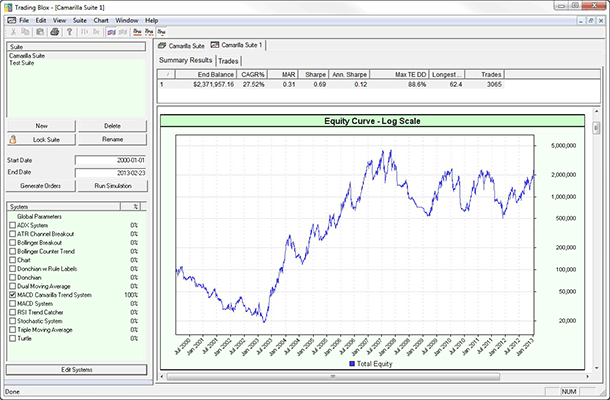
FIGURE 15: TRADING BLOX, SYSTEM RESULTS. Here is a performance summary for the MACD camarilla trend system.
In “Camarilla Points” in this issue, author Slawomir Bobrowski presents an interesting concept applied to the end-of-day trading environment.
Once I had his charts recreated in Excel, I found it very instructive to watch the various levels adjust as I scrolled the camarilla bar across the chart (Figure 16). You can then change the trading day length up or down and scroll through the chart again.
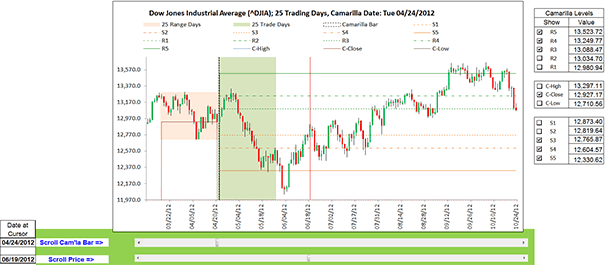
FIGURE 16: MICROSOFT EXCEL. This sample camarilla chart shows the range days lookback area used to establish the base high-low-close values and the trading days area with key camarilla levels displayed.
In his article, Bobrowski cautions the reader to do his or her own statistical testing as to how to go about selecting camarilla dates and trading day lengths. Small differences in either setting can have a dramatic impact on the camarilla levels. As Bobrowski reminds us, it is just good trading hygiene to always have appropriate protective stops in place.
The spreadsheet file for this Traders’ Tip can be downloaded as follows: