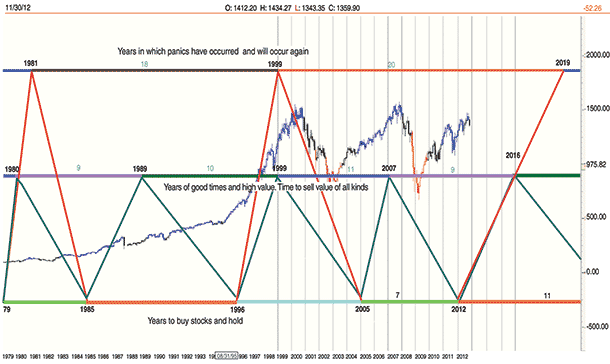
FIGURE 1: THE KONDRATIEFF WAVE. Here you see the Kondratieff wave with the chart of the S&P 500 till November 18, 2012, overlaid on it. This S&P 500 has followed the trend up, suggested by the K-wave, but with a lot of volatility.
CYCLES
How’d They Do?
What happens to the markets when a US President is elected for a second term?
My article “The Kondratieff Wave And The Presidential Cycle” was published in July 2012. At the end of it, I concluded that “with the K-wave suggesting a rise into 2016, the pattern suggests that President Obama will be reelected.” It is gratifying to know that technical analysis and the cyclical pattern can predict the future. But to be honest, I hedged my bets with this statement:
Although the relationship between the Presidential election cycle and the stock market appears to be strong, it does not mean that the play will be the same every cycle. However, when combined with technical analysis, additional insights can assist investors in their investment decisions.
Keeping that in mind, looking at the Presidential cycle in closer detail bears study. Why, for example, did the market fall the week after President Obama was reelected? Was this correction forecast by the Presidential cycle? Surely, the Dow Jones Industrial Average (DJIA), the Standard & Poor’s 500, and the NASDAQ should have continued rising as forecast by the Kondratieff wave. Surely those Republicans who bought shares betting on a win by their candidate would not have sold their shares indiscriminately without looking at the technicals first?
THE PRESIDENTIAL CYCLE
To figure out all these unknowns, a closer study of the Presidential cycle is necessary. I have also added the Federal Reserve chairmanship cycle to the chart to see if this cycle has any bearing on the movement of the market. Figure 1 shows the Kondratieff wave updated, with an overlay of the S&P 500 to November 18, 2012.
As you can see, the S&P 500 has followed the trend up as suggested by the K-wave, but with a great deal of volatility.
FIGURE 1: THE KONDRATIEFF WAVE. Here you see the Kondratieff wave with the chart of the S&P 500 till November 18, 2012, overlaid on it. This S&P 500 has followed the trend up, suggested by the K-wave, but with a lot of volatility.