TRADERS’ TIPS
April 2013
Here is this month’s selection of Traders’ Tips, contributed by
various developers of technical analysis software to help readers more easily
implement some of the strategies presented in this and other issues.
Other code appearing in articles in this issue is posted in the Subscriber
Area of our website at https://technical.traders.com/sub/sublogin.asp.
Login requires your last name and subscription number (from mailing label).
Once logged in, scroll down to beneath the “Optimized trading systems” area
until you see “Code from articles.” From there, code can be copied
and pasted into the appropriate technical analysis program so that no retyping
of code is required for subscribers.
You can copy these formulas and programs for easy use in your spreadsheet
or analysis software. Simply “select” the desired text
by highlighting as you would in any word processing program, then use your
standard key command for copy or choose “copy” from the browser
menu. The copied text can then be “pasted” into any open spreadsheet
or other software by selecting an insertion point and executing a paste command.
By toggling back and forth between an application window and the open web
page, data can be transferred with ease.

For this month’s Traders’ Tips, the focus is Ron McEwan’s article in this issue, “Low-Frequency Trading.”
Spreadsheet formulas for Microsoft Excel are already provided in McEwan’s article. Subscribers will find a copy of his spreadsheet in the Subscriber Area of our website, Traders.com. (Click on “Article Code” from our homepage.) Presented here is additional code and possible implementations for other software.

TRADESTATION: APRIL 2013 TRADERS’ TIPS CODE
In “Low-Frequency Trading” in this issue, author Ron McEwan describes a trading style referred to as low-frequency trading. His article describes the construction of an indicator that plots a cumulative percent advance-decline line (CumAD) of the advancing and declining issues and a one-year simple moving average of CumAD. The calculations are illustrated in an Excel workbook created by the author.
Provided here is a function that calculates the CumAD, an indicator that plots the CumAD and a moving average of the CumAD, plus a strategy. The strategy enters long when the CumAD crosses over its moving average and sells (exits the long, but does not enter short) when CumAD crosses under its moving average. Note that the function code utilizes multiple datastreams to calculate the CumAD values on each bar. Datastreams for advancing issues and declining issues must be added to the chart. The function is flexible and allows for specifying which datastream number (for example, 2 for Data2, 3 for Data3, and so on) contains the data for advancing issues and which datastream number contains the data for declining issues.
To download the EasyLanguage code, first navigate to the EasyLanguage FAQs and Reference Posts Topic in the EasyLanguage support forum (https://www.tradestation.com/Discussions/Topic.aspx?Topic_ID=47452), scroll down, and click on the link labeled “Traders’ Tips, TASC.” Then select the appropriate link for the month and year. The ELD filename is “_TASC_LowFrequencyTrading.ELD.” The code is also shown at below.
_TASC_LowFreqTrading_CumAD (Series Function)

{ TASC Article, April, 2013 }
{ "Low-Frequency Trading" }
{ Ron McEwan }

{ this function uses multiple data streams }

inputs:
	int AdvDataStream( numericsimple ), { data stream
	 number containing the data for advancing issues,
	 for example, if $ADV is used for advancing
	 issues and it is in data stream 2 (i.e., Data2),
	 pass in 2 }
	int DeclDataStream( numericsimple ) ; { data
	 stream number containing the data for declining
	 issues, for example, if $DECL is used for
	 declining issues and it is in data stream 3
	 (i.e., Data3), pass in 3 }

 variables:
 	double AdvIssues( 0 ),
 	double DeclIssues( 0 ),
 	double AdvDeclDelta( 0 ),
 	double ADPct( 0 ),
 	double CumAD( 0 ) ;

AdvIssues = Close of Data( AdvDataStream ) ;
DeclIssues = Close of Data( DeclDataStream ) ;
AdvDeclDelta = AdvIssues - DeclIssues ;

if AdvIssues + DeclIssues <> 0 then
	ADPct = AdvDeclDelta /
	 ( AdvIssues + DeclIssues ) * 1000 ;

CumAD += ADPct ;

_TASC_LowFreqTrading_CumAD = CumAD ;

{
since this is a cumulative calculation, this
function needs to be called on every bar; this line
of code forces the function to be series
}
 once Value99 = _TASC_LowFreqTrading_CumAD[1] ;


_TASC_LowFreqTrading_Ind (Indicator)


{ TASC Article, April, 2013 }
{ "Low-Frequency Trading" }
{ Ron McEwan }

inputs:
  	int AvgLength( 260 ) ; { number of bars for
  	 average of cumAD line }

variables:
	double CumAD( 0 ),
	double AvgCumAD( 0 ) ;

{
call function to get CumAD; the function parameters
of 2 and 3 reflect a chart setup with the Advance
Issues in Dat2 and the Decline Issues in Data3; for
more on the function parameters/inputs, see the
function code
}
CumAD = _TASC_LowFreqTrading_CumAD( 2, 3 ) ;
AvgCumAD = Average( CumAD, AvgLength ) ;

{ wait until enough bars have calculated to have
  valid average values }
if CurrentBar >= AvgLength then
	begin
	Plot1( CumAD, "CumAD" ) ;
	Plot2( AvgCumAD, "AvgCumAD" ) ;
	end ;

_TASC_LowFreqTrading_Strat (Strategy)

{ TASC Article, April, 2013 }
{ "Low-Frequency Trading" }
{ Ron McEwan }
{ this strategy is for illustrative purposes only and
  was not designed to be traded }

inputs:
  	int AvgLength( 260 ) ; { number of bars for
  	 average of cumAD line }

variables:
	bool OkToTrade( false ),
	double CumAD( 0 ),
	double AvgCumAD( 0 ) ;

{
call function to get CumAD; the function parameters
of 2 and 3 reflect a chart setup with the Advance
Issues in Data2 and the Decline Issues in Data3; for
more on the function parameters/inputs, see the
function code
}
CumAD = _TASC_LowFreqTrading_CumAD( 2, 3 ) ;
AvgCumAD = Average( CumAD, AvgLength ) ;

{ wait until enough bars have calculated to have
  valid average values }
once ( CurrentBar >= AvgLength )
	OkToTrade = true ;

{ entry }
if OkToTrade then
	begin
	if CumAD crosses over AvgCumAD then
		Buy ( "LFT LE" ) next bar market ;
	end ;

{ exit }
if CumAD crosses under AvgCumAD then
	Sell ( "LFT LX" ) next bar market ;
A sample chart is shown in Figure 1.
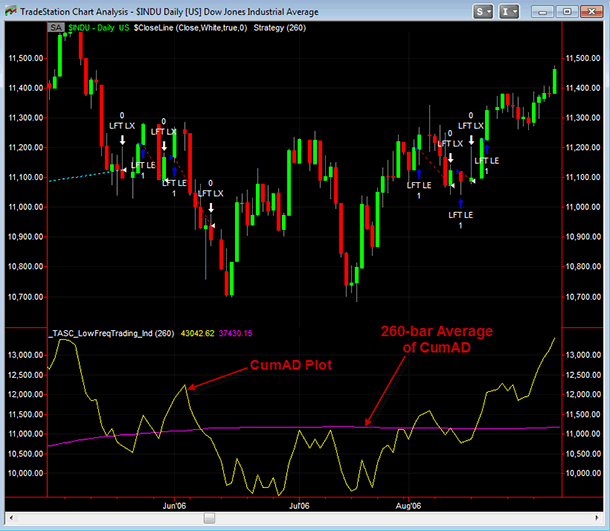
FIGURE 1: TRADESTATION. Here is a daily chart of $INDU with the LowFreqTrading indicator and strategy applied to the chart. The yellow plot is the CumAD line and the magenta plot is the 260-bar simple moving average of the CumAD line. In addition, the EasyLanguage code makes use of multiple datastreams. The symbol in Data2 is $ADV (advancing issues) and the symbol in Data3 is $DECL (declining issues). These Data2 and Data3 datastreams are both set to daily bars and are hidden.
This article is for informational purposes. No type of trading or investment recommendation, advice, or strategy is being made, given, or in any manner provided by TradeStation Securities or its affiliates.
—Chris Imhof
TradeStation Securities, Inc.
A subsidiary of TradeStation Group, Inc.
www.TradeStation.com
BACK TO LIST

eSIGNAL: APRIL 2013 TRADERS’ TIPS CODE
For this month’s Traders’ Tips we’ve provided the following formula, OneYear_CumAdvDecMA.efs, based on Ron McEwan’s article in this issue, “Low-Frequency Trading.”
The study contains formula parameters to set the colors for long and short signals as well as the length for the SMA, which may be configured through the Edit Chart window. This study is also compatible for backtesting.
To discuss this study or download a complete copy of the formula code, please visit the EFS Library Discussion Board forum under the Forums link from the Support menu at www.esignal.com or visit our EFS KnowledgeBase at https://www.esignal.com/support/kb/efs/. The eSignal formula scripts (EFS) are also available for copying and pasting below.
/*********************************
Provided By:
eSignal (Copyright c eSignal), a division of Interactive Data
Corporation. 2012. All rights reserved. This sample eSignal
Formula Script (EFS) is for educational purposes only and may be
modified and saved under a new file name.  eSignal is not responsible
for the functionality once modified.  eSignal reserves the right
to modify and overwrite this EFS file with each new release.

Description:
    Low-Frequency Trading, by Ron McEwan

Version:            1.00  02/08/2013

Formula Parameters:                         Default:
SMA Length                                  253

Long Position Color                         lime

Short Position Color                        red

Notes:
The related article is copyrighted material. If you are not a subscriber
of Stocks & Commodities, please visit www.traders.com.

**********************************/

var fpArray = new Array();

function preMain()
{
    setStudyTitle("OneYear_CumAdvDecMA");

    setIntervalsBackfill(true);


    setCursorLabelName("Cum AD Line",0);

    setCursorLabelName("MA",1);


    setDefaultBarFgColor(Color.blue, 0);
    setDefaultBarFgColor(Color.purple, 1);

    var x = 0;

    fpArray[x] = new FunctionParameter("gLength", FunctionParameter.NUMBER);
    with(fpArray[x++])
    {
        setName("SMA Length");

        setLowerLimit(1);
        setDefault(253);
    }


    fpArray[x] = new FunctionParameter("gBuyColor", FunctionParameter.COLOR);
    with(fpArray[x++])
    {
        setName("Long Position Color");
        setDefault(Color.lime);
    }

    fpArray[x] = new FunctionParameter("gSellColor", FunctionParameter.COLOR);
    with(fpArray[x++])
    {
        setName("Short Position Color");
        setDefault(Color.red);
    }

}

var bInit = false;
var bVersion = null;


var xCumAd = null;

var xSMA = null;

function main(gLength,gBuyColor,gSellColor)
{
    if (bVersion == null) bVersion = verify();
    if (bVersion == false) return;


    if (!bInit)

    {

        xCumAd=efsInternal("getCumAd");

        xSMA = sma(gLength,xCumAd);

    }


    var nCumAd = xCumAd.getValue(0);

    var nSMA = xSMA.getValue(0);


    if (nCumAd == null || nSMA == null) return;


    if (getCurrentBarIndex() != 0)
    {
            var bLStrategy = Strategy.isLong();

            if (!bLStrategy)
            {
                if (nCumAd>nSMA)
                {
                   Strategy.doLong("Enter Long", Strategy.CLOSE, Strategy.THISBAR);

                   drawShapeRelative(0, BottomRow3,Shape.DIAMOND,null, gBuyColor, Shape.PRESET);
                }
            }
            else
            {
                if (nCumAd<nSMA)
                {
                    Strategy.doSell("Close Long", Strategy.CLOSE, Strategy.THISBAR);

                    drawShapeRelative(0, TopRow3,Shape.DIAMOND,null, gSellColor, Shape.PRESET);
                }
            }
    }

    return new Array(nCumAd,nSMA);
}

var bCumAd = false;


var xAdv = null;

var xDecl = null;


var cumAd = 0;


function getCumAd()

{

    if (getBarState() == BARSTATE_ALLBARS)

    {

        bCumAd = false;

    }


     if(!bCumAd)
    {
        xAdv = close(sym("$ADV,D"));

        xDecl = close(sym("$DECL,D"));

        cumAd = 0;

        bCumAd = true;
    }


    var nAdv = xAdv.getValue(0);

    var nDecl = xDecl.getValue(0);


    if (nAdv == null || nDecl == null || (nAdv+nDecl)==0) return;


    var pctChg = (nAdv-nDecl)/(nAdv+nDecl)*1000;


    var ret = ref(-1);


    cumAd = ret + pctChg;


    return cumAd;

}


function verify() {
    var b = false;
    if (getBuildNumber() < 779) {
        drawTextAbsolute(5, 35, "This study requires version 8.0 or later.",
            Color.white, Color.blue, Text.RELATIVETOBOTTOM|Text.RELATIVETOLEFT|Text.BOLD|Text.LEFT,
            null, 13, "error");
        drawTextAbsolute(5, 20, "Click HERE to upgrade.@URL=https://www.esignal.com/download/default.asp",
            Color.white, Color.blue, Text.RELATIVETOBOTTOM|Text.RELATIVETOLEFT|Text.BOLD|Text.LEFT,
            null, 13, "upgrade");
        return b;
    } else {
        b = true;
    }
    return b;
}
A sample chart is shown in Figure 2.
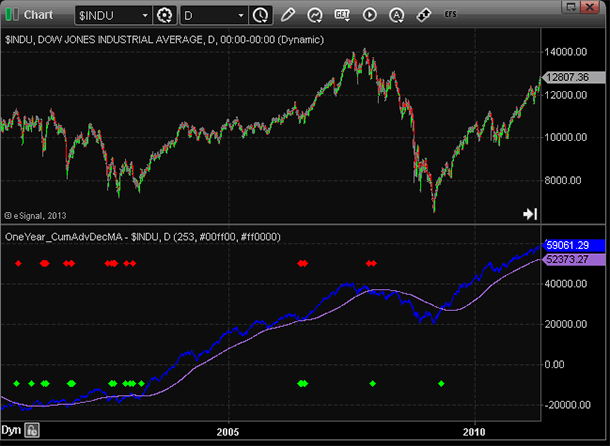
FIGURE 2: eSIGNAL. Here is an example of the one-year cumulative advance-decline moving average on a chart.
—Jason Keck
eSignal, an Interactive Data company
800 779-6555, www.eSignal.com
BACK TO LIST

THINKORSWIM: APRIL 2013 TRADERS’ TIPS CODE
In “Low-Frequency Trading” in this issue, Ron McEwan describes a strategy that is catered to the retail trader. The article focuses on using a strategy based on the advance-decline line in order to make simple, longer-term trades.
For thinkorswim users, we have created a study and a strategy in our proprietary scripting language, thinkScript. Once the strategy has been added to your chart (Figure 3), you can right-click on the name of the strategy on the price graph, and choose “Show report.” This will allow you to see how the strategy has performed over the charted time frame. Adjust the parameters of the strategy within the Edit Studies window to fine tune your entry and exit points.
The studies:
- From TOS charts, select Studies → Edit studies
- Select the “Studies” tab in the upper left-hand corner
- Select “New” in the lower left-hand corner
- There are three studies this month separated by #s
- Name the study (such as “AdvanceDeclineCumulativeAvg”)
- Click in the script editor window, remove “plot data = close” and paste in the following code:
###################
declare lower;

input exchange = {default NYSE, NASDAQ, AMEX};
input length = 252;

def advnDecnPctChg = 1000  * AdvanceDecline(type = "Advance/Decline Line (Daily)");
def cumAdvnDecn = cumAdvnDecn[1] + if !IsNaN(advnDecnPctChg) then advnDecnPctChg else 0;

plot CumAD = if !IsNaN(advnDecnPctChg) then cumAdvnDecn else Double.NaN;
plot AvgCumAD = Sum(if !IsNaN(CumAD) then CumAD else 0, length) / Sum(if !IsNaN(CumAD) then 1 else 0, length);

CumAD.DefineColor("Above", Color.UPTICK);
CumAD.DefineColor("Below", Color.DOWNTICK);
CumAD.AssignValueColor(if CumAD > AvgCumAD then CumAD.Color("Above") else CumAD.Color("Below"));
AvgCumAD.SetDefaultColor(GetColor(7));
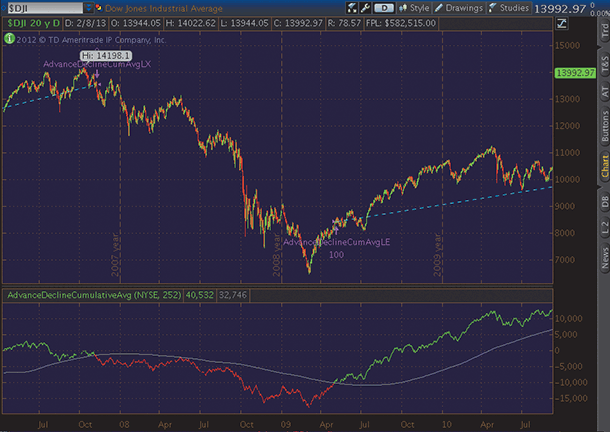
FIGURE 3: THINKORSWIM. Here is a display of the AdvanceDeclineCumulativeAvg study.
The strategy:
- From TOS charts, select Studies → Edit studies
- Select the “Strategies” tab in the upper left-hand corner
- Select “New” in the lower left-hand corner
- Name the study (such as, “AdvanceDeclineCumulativeAvg”)
- Click in the script editor window, remove “plot data = close” and paste in the following code:
input exchange = {default NYSE, NASDAQ, AMEX};
input length = 252;

def advnDecnPctChg = 1000  * AdvanceDecline(type = "Advance/Decline Line (Daily)");
def cumAdvnDecn = cumAdvnDecn[1] + if !IsNaN(advnDecnPctChg) then advnDecnPctChg else 0;

def CumAD = if !IsNaN(advnDecnPctChg) then cumAdvnDecn else Double.NaN;
def AvgCumAD = Sum(if !IsNaN(CumAD) then CumAD else 0, length) / Sum(if !IsNaN(CumAD) then 1 else 0, length);

AddOrder(OrderType.BUY_AUTO, CumAD > AvgCumAD, name = "AdvanceDeclineCumAvgLE");
AddOrder(OrderType.SELL_TO_CLOSE, CumAD < AvgCumAD, name = "AdvanceDeclineCumAvgLX");
—thinkorswim
A division of TD Ameritrade, Inc.
www.thinkorswim.com
BACK TO LIST

WEALTH-LAB: APRIL 2013 TRADERS’ TIPS CODE
In his article in this issue, “Low-Frequency Trading,” Ron McEwan introduces a formula that loosely resembles another market breadth indicator known as the “Swenlin trading oscillator” (STO). Created by Carl Swenlin, it’s intended to be an overbought/oversold indicator that can assist in identifying short-term tops and bottoms.
Both market breadth indexes start with the same basic component: the daily percent change of advancers/decliners multiplied by 1,000. But unlike the STO, which double-smoothes it by applying a four-day exponential moving average of the result and then a five-day simple moving average on it, McEwan’s indicator first cumulates the value and then smoothes it with a one-year SMA. This automatically turns it into a long-term indicator, since the rationale behind its creation is to present a less stressful way of trading. See Figure 4.
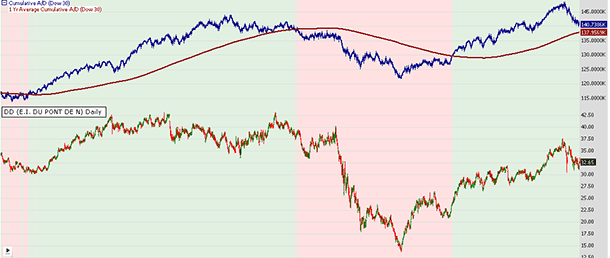
FIGURE 4: WEALTH-LAB. This Wealth-Lab 6.4 chart shows Ron McEwan’s market breadth index applied to a daily chart. The indicator is built against the 30 DJIA stocks. Selling opportunities are highlighted in red, bullish trends in green.
There’s no reason not to apply this market breadth formula to any custom portfolio, not just NYSE stocks. By adjusting the SMA period, motivated traders can experiment with a different investment horizon.
To use this indicator as a component of a Wealth-Lab trading system, perform these easy steps:
- Install the “MS123 IndexDefinitions” library from the Extensions section of our website, www.wealth-lab.com, and restart Wealth-Lab.
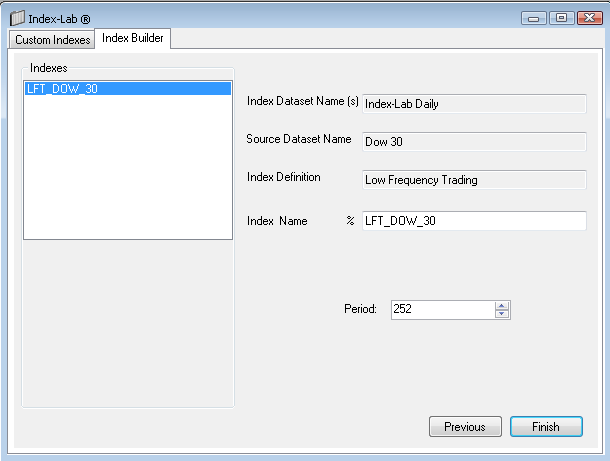
- In the Index-Lab tool, select a DataSet of the DJIA 30 stocks (or NYSE, or your favorite watchlist) and select “Low frequency trading” from the list of available indexes to create the customized index. Type in “LFT_DOW_30” as the index name:
- Paste in the included strategy’s C# code, or simply let Wealth-Lab do the job: in the “Open strategy” dialog, click “download” to get the strategy code.
C# Code:

using System;
using System.Text;
using System.Drawing;
using WealthLab;
using WealthLab.Indicators;

namespace WealthLab.Strategies
{
	public class LFT_demo : WealthScript
	{
		protected override void Execute()
		{
			DataSeries lftRaw = GetExternalSymbol("%LFT_DOW_30",true).Volume;
			DataSeries lft = GetExternalSymbol("%LFT_DOW_30",true).Close;
			lftRaw.Description = "Cumulative A/D (Dow 30)";
			lft.Description = "1 Yr Average Cumulative A/D (Dow 30)";

			HideVolume();
			ChartPane lftPane = CreatePane( 70,true,true );
			PlotSeries( lftPane, lftRaw, Color.DarkBlue, LineStyle.Solid, 2);
			PlotSeries( lftPane, lft, Color.DarkRed, LineStyle.Solid, 2);

			for(int bar = lft.FirstValidValue; bar < Bars.Count; bar++)
			{
				bool buy = lftRaw[bar] > lft[bar];
				bool sell = lftRaw[bar] < lft[bar];

				if( sell )
					SetBackgroundColor( bar, Color.FromArgb( 30, Color.Red ) );
				if( buy )
					SetBackgroundColor( bar, Color.FromArgb( 30, Color.Green ) );
			}
		}
	}
}
—Wealth-Lab team
MS123, LLC
www.wealth-lab.com
BACK TO LIST

AMIBROKER: APRIL 2013 TRADERS’ TIPS CODE
In “Low-Frequency Trading” in this issue, author Ron McEwan presents a market sentiment indicator based on market advance-decline data.
A ready-to-use formula for the indicator is presented here. To display the indicator, simply input the formula into the formula editor and press “Apply indicator.” Depending on the data source you are using, you may need to change the symbols for advancing and declining issues. The example formula we’re showing here uses eSignal symbology. You may also build your own composite A/D data using AmiBroker’s “calculate composites” tool.
A sample chart is shown in Figure 5.
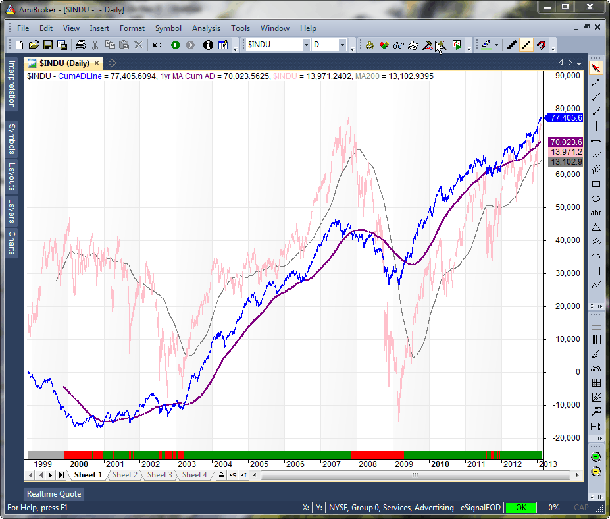
FIGURE 5: AMIBROKER. Here is a daily chart of the one-year moving average of the cumulative advance-decline line (violet line), with a colored ribbon showing bullish (green) and bearish (red) periods.
AmiBroker Formula
// advancing issues - the symbol depends on data source
adv = Foreign("$ADV", "C" );
// declining issues - the symbol depends on data source
dec = Foreign("$DECL", "C" );

AdChg = 1000*(adv-dec)/(adv+dec);
CumAd = Cum( AdChg );
AvgCumAd = MA( CumAd, 254 );

GraphXSpace = 10;
Plot( CumAd, "CumADLine", colorBlue );
Plot( AvgCumAd, "1yr MA Cum AD", colorViolet, styleThick );
Plot( C, Name(), colorPink, styleLine | styleLeftAxisScale );
Plot( MA( C, 200 ), "MA200", colorGrey50, styleLeftAxisScale );

Plot( 1, "", IIf( CumAd > AvgCumAd, colorGreen, colorRed ),
      styleArea | styleOwnScale | styleNoLabel, 0, 50 );
—Tomasz Janeczko, AmiBroker.com
www.amibroker.com
BACK TO LIST

NEUROSHELL TRADER: APRIL 2013 TRADERS’ TIPS CODE
The low-frequency trading system based on advancing and declining issues described by Ron McEwan in his article in this issue (“Low-Frequency Trading”) can be easily implemented in NeuroShell Trader.
To recreate his cumulative advance/decline line indicator, select “New Indicator...” from the Insert menu, use the Indicator Wizard to set up the following indicators, and select “other instrument data” to choose the advancing and declining issue data as indicator parameters.
Cumulative Advance-Decline Line

CumSum( Multiply2( Advance-Decline/Advance+Decline Ratio( NYSE Advancing Issues, NYSE Declining Issues ) ), 0 )
To recreate the moving average–based trading system, select “New Trading Strategy...” from the Insert menu and enter the following in the appropriate locations of the Trading Strategy Wizard:
Generate a buy long market order if all of the following are true:
Price>Average( Cumulative Advance-Decline Line, 254 )
Generate a sell long market order if all of the following are true:
Price<Average( Cumulative Advance-Decline Line, 254 )
If you have NeuroShell Trader Professional, you can also choose whether the moving average size should be optimized. After backtesting the trading strategy, use the “Detailed analysis...” button to view the backtest and trade-by-trade statistics for the strategy.
Users of NeuroShell Trader can go to the Stocks & Commodities section of the NeuroShell Trader free technical support website to download a copy of this or any previous Traders’ Tips.
A sample chart is shown in Figure 6.
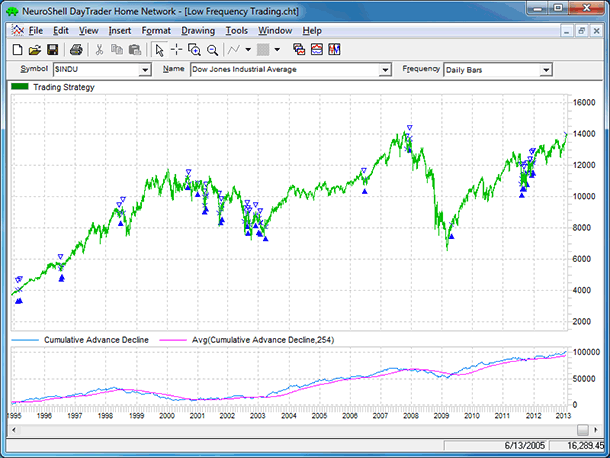
FIGURE 6: NEUROSHELL TRADER. This sample NeuroShell Trader chart shows the advancing and declining issues based on Ron McEwan’s Low-Frequency Trading system.
—Marge Sherald, Ward Systems Group, Inc.
301 662-7950, sales@wardsystems.com
www.neuroshell.com
BACK TO LIST

AIQ: APRIL 2013 TRADERS’ TIPS CODE
The AIQ code based on Ron McEwan’s article in this issue, “Low-Frequency Trading,” is provided at the following website: www.TradersEdgeSystems.com/traderstips.htm.
The cumulative indicators on the advances and declines for the NYSE are provided in the first section of code that follows. However, I have never liked cumulative indicators because results can vary depending on where the accumulation is started. I do not recommend using the first code set below that replicates the author’s indicator because it runs so slowly that you will think your computer is frozen. Thus, I coded an alternative that uses the built-in advance-decline (A/D) line and then takes a moving average of the built-in A/D line. This version runs quickly and probably gives similar results.
I did not test the first coded version. I tested my second code set as a timing system on the S&P 500 ETF (SPY) from 1981 to 2/12/2013 (Figure 7). As with most timing systems, the risk was reduced based on a lower sigma than that of the markets and the return was also less than just buying and holding the SPY for the test period.
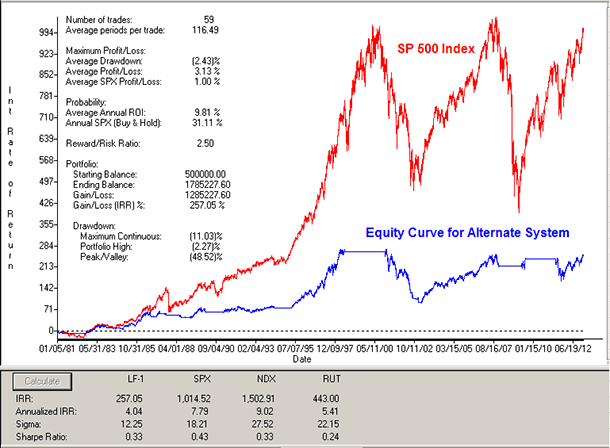
FIGURE 7: AIQ. Here is a sample equity curve for the alternative system trading the SPY from 1/5/1981 to 2/12/2013 compared to the S&P 500 (SPX).
The code and EDS file can be downloaded from www.TradersEdgeSystems.com/traderstips.htm. The code is also shown below.
!LOW-FREQUENCY TRADING
!Author: Ron McEwan, TASC April 2013
!Coded by: Richard Denning
!www.TradersEdgeSystems.com

!INPUT:
advMAlen is 252.

!ABBREVIATIONS:
C 	is [close].
OSD 	is offSetToDate(month(),day(),year()).

!AUTHORS INDICATOR AND SYSTEM (processes very slowly-see alternate below):
DaysToStart is min(advMAlen,scanany(month()=02 and day()=05 and year()=1980,252*50) then OSD).
NYadv is TickerUDF("DJIA",[Adv Issues]).
NYdec is TickerUDF("DJIA",[Dec Issues]).
ADVpctTot is (NYadv-NYdec) / (NYadv+NYdec) * 1000.
ADVcumPct is sum(ADVpctTot,^DaysToStart).
ADVcumPctMA is simpleavg(ADVcumPct,252).
HD if hasdatafor(advMAlen +10) > advMAlen.
Buy if ADVcumPct > ADVcumPctMA and HD.
Sell if ADVcumPct < ADVcumPctMA.

!ALTERNATE TO ABOVE (due to processing speed recommend that this one is used):
ADline is tickerUDF("DJIA",[AD Line]).
ADlineMA is simpleavg(ADline,252).
BuyAlt if ADline > ADlineMA and HD.
SellAlt if ADline < ADlineMA.
—Richard Denning
info@TradersEdgeSystems.com
for AIQ Systems
BACK TO LIST

TRADERSSTUDIO: APRIL 2013 TRADERS’ TIPS CODE
The TradersStudio code based on Ron McEwan’s article in this issue, “Low-Frequency Trading,” is provided at the following websites:
The following code file is provided in the download:
- Indicator plot: “LF_TRD_IND” is the indicator code that plots the advance/decline indicator and its moving average
- System: “LF_TRD” is the system described by Ron McEwan.
The code is also shown below.
'LOW-FREQUENCY TRADING
'Author: Ron McEwan, TASC April 2013
'Coded by: Richard Denning
'www.TradersEdgeSystems.com

'INDICATOR AND SYSTEM CODE:
Sub LF_TRD(maLen)
Dim NYadv As BarArray
Dim NYdec As BarArray
Dim ADVpctTot As BarArray
Dim ADVcumPct As BarArray
Dim ADVcumPctMA As BarArray
Dim n
NYadv = C Of independent1    'NYSE Advancing Issues
NYdec = C Of independent2    'NYSE Declining Issues
If (NYadv+NYdec) > 0 Then ADVpctTot = (NYadv-NYdec) / (NYadv+NYdec) * 1000
n = BarNumber - BarSize - 1
If n = 0 Then ADVcumPct = ADVpctTot
If n>=1 Then ADVcumPct = ADVcumPct + ADVpctTot
ADVcumPctMA = Average(ADVcumPct,maLen)
If ADVcumPct > ADVcumPctMA Then Buy("LE",1,0,Market,Day)
If ADVcumPct < ADVcumPctMA Then ExitLong("LX","",1,0,Market,Day)
End Sub
'--------------------------------------------------------------------------
'FOR PLOTTING THE INDICATORS:
Sub LF_TRD_IND(maLen)
Dim NYadv As BarArray
Dim NYdec As BarArray
Dim ADVpctTot As BarArray
Dim ADVcumPct As BarArray
Dim ADVcumPctMA As BarArray
Dim n
NYadv = C Of independent1    'NYSE Advancing Issues
NYdec = C Of independent2    'NYSE Declining Issues
If (NYadv+NYdec) > 0 Then ADVpctTot = (NYadv-NYdec) / (NYadv+NYdec) * 1000
n = BarNumber - BarSize - 1
If n = 0 Then ADVcumPct = ADVpctTot
If n>=1 Then ADVcumPct = ADVcumPct + ADVpctTot
ADVcumPctMA = Average(ADVcumPct,maLen)
plot1(ADVcumPct)
plot2(ADVcumPctMA)
End Sub
'--------------------------------------------------------------------------
I set up a test session using the S&P & MD futures contract (using data from Pinnacle Data). After optimizing the single parameter in the system, I chose 70 as the length to use. In Figure 8, I show the equity curve and underwater equity curve trading one contract from 1984 to 2013.
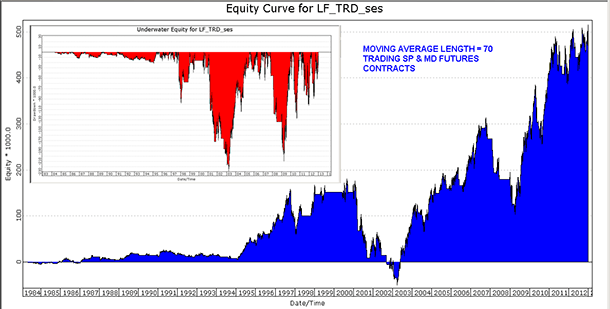
FIGURE 8: TRADERSSTUDIO. Here are sample equity and underwater equity curves for the LF_TRD system trading one contract of the SPX and one contract of the MD from 1984 through 2013.
—Richard Denning
info@TradersEdgeSystems.com
for TradersStudio
BACK TO LIST

NINJATRADER: APRIL 2013 TRADERS’ TIPS CODE
We have implemented LowFrequencyATS based on Ron McEwan’s article in this issue, “Low-Frequency Trading,” as an automated strategy available for download at www.ninjatrader.com/SC/April2013SC.zip.
Once you have downloaded it, from within the NinjaTrader Control Center window, select the menu File → Utilities → Import NinjaScript and select the downloaded file. To use the ExternalData version of the strategy, you will first need to extract McEwanwrkbk.txt from the zip file and place into your Documents\NinjaTrader 7 directory. This file is for NinjaTrader version 7 or greater.
You can review the strategy source code by selecting the menu Tools → Edit NinjaScript → Strategy from within the NinjaTrader Control Center window and selecting either LowFrequencyATSCalculated or LowFrequencyATSExternalData.
A sample chart implementing the strategy is shown in Figure 9.
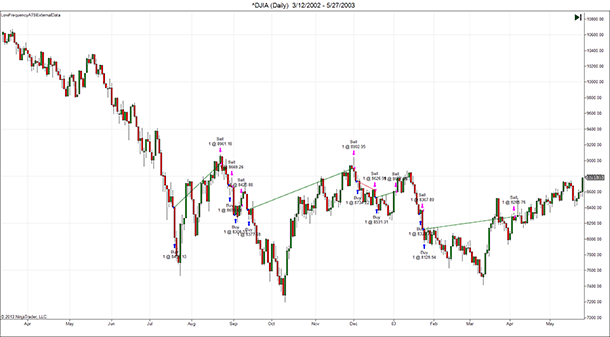
FIGURE 9: NINJATRADER. This screenshot shows LowFrequencyATSExternalData applied to a daily chart of the Dow Jones Industrial Average index (DJIA).
—Raymond Deux & Ryan Millard
NinjaTrader, LLC
www.ninjatrader.com
BACK TO LIST

UPDATA: APRIL 2013 TRADERS’ TIPS CODE
In “Low-Frequency Trading” in this issue, author Ron McEwan delivers a market breadth–based indicator, expressing the difference between advances and declines as a fraction of total advances and declines. The cumulative sum of this ratio is then smoothed with a 256-day (approximately one-year) average. It is suggested that this tool is useful for low-frequency traders, taking directional biases from transitions above and below the long-term average.
The Updata code for this indicator is in the Updata Library and may be downloaded by clicking the Custom menu and then Indicator Library. Those who cannot access the library may paste the code shown here into the Updata Custom editor and save it. A sample chart is shown in Figure 10.
PARAMETER "Choose Watchlist"  &MyList=Select
PARAMETER "Avg Period" #PERIOD=256
NAME "Low Frequency Trading[" #PERIOD "]" ""
DISPLAYSTYLE 3LINES
INDICATORTYPE TOOL
INDICATORTYPE2 CHART SUPERIMPOSELEFT
INDICATORTYPE3 CHART SUPERIMPOSELEFT
PLOTSTYLE LINE RGB(255,0,0)
PLOTSTYLE2 LINE RGB(0,0,200)
PLOTSTYLE3 LINE RGB(0,200,0)
#DeclIssues=0
#AdvIssues=0
#ShareNumber=0
@Change=0
@Cumulative=0
@CumulativeAvg=0

FOR #CURDATE=#PERIOD TO #LASTDATE
    #DeclIssues=0
    #AdvIssues=0
    'Format example : Close('SPX Index',1) is first stock in
    'SPX Index constituents as ordered in watchlist
    'Loop Across Index Constituents
    FOR #ShareNumber=0 to LENGTH(&MyList)-1
       IF CLOSE(&MyList,#ShareNumber)<Hist(CLOSE(&MyList,#ShareNumber),1)
          #DeclIssues=#DeclIssues+1
       ELSEIF CLOSE(&MyList,#ShareNumber)>Hist(CLOSE(&MyList,#ShareNumber),1)
          #AdvIssues=#AdvIssues+1
       ENDIF
    NEXT
    @Change=1000*(#AdvIssues-#DeclIssues)/(#AdvIssues+#DeclIssues)
    @Cumulative=@Cumulative+@Change
    @CumulativeAvg=SGNL(@Cumulative,#PERIOD,M)
    'Smooths underlying price series
    @PLOT=MAVE(#PERIOD)
    @PLOT2=@Cumulative
    @PLOT3=@CumulativeAvg
NEXT
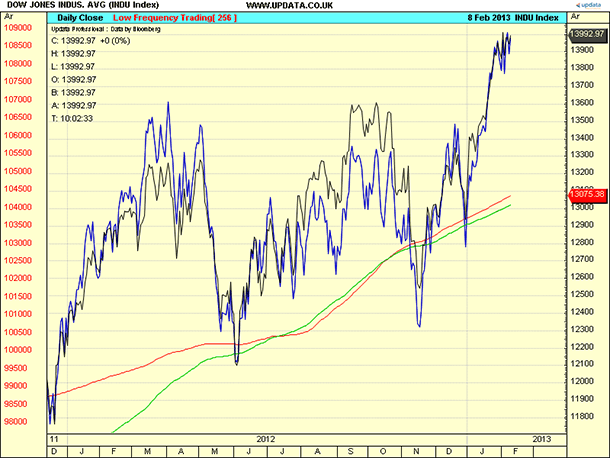
FIGURE 10: UPDATA. The daily Dow Jones Industrial Average is plotted with its cumulative advance/decline–based ratio plotted using the left axis and their respective averages. The underlying index is in long bias mode.
—Updata support team
support@updata.co.uk
www.updata.co.uk
BACK TO LIST

TRADE NAVIGATOR: APRIL 2013 TRADERS’ TIPS CODE
You can recreate the custom indicator described by author Ron McEwan in his article in this issue, “Low-Frequency Trading,” by using the following TradeSense code.
First, open the Trader’s Toolbox, click on the Functions tab and click the “New” button. Input the following code:
MovingAvg (CumulativeSum (((Close Of "$ADV" - Close Of "$decl") / (Close Of "$ADV" + Close Of "$decl")) * 1000 , 0) , X)
With the function created, go to a chart and bring up the “Add to chart” window by clicking on the chart and typing “A” on the keyboard. Click on the Indicators tab, find the “Daily AD percent change” indicator in the list and either double-click on it or highlight the name and click the Add button. Type “E” on your keyboard to bring up the chart settings window. Highlight the indicator and change it to the desired color in the chart settings window. Click OK. See Figure 11.
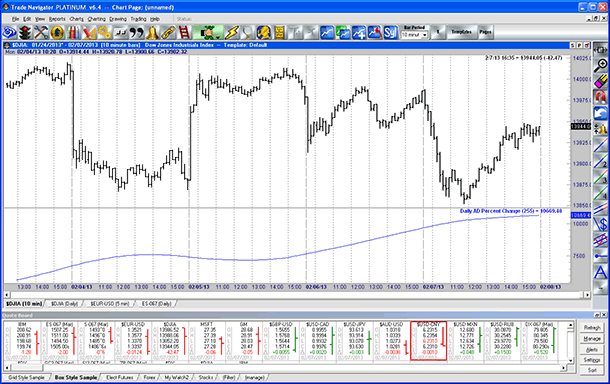
FIGURE 11: TRADE NAVIGATOR. Here is the daily AD percent change indicator on a 10-minute chart of $DJIA.
Genesis Financial Technologies is providing a library called “Low frequency trading” that includes the custom indicator discussed in McEwan’s article. You can download the special file named “SC201304” through Trade Navigator.
—Michael Herman
Genesis Financial Technologies
www.TradeNavigator.com
BACK TO LIST

TRADING BLOX: APRIL 2013 TRADERS’ TIPS CODE
One of the strengths of Trading Blox is that it can utilize all kinds of time series data as inputs to trading decisions. Ron McEwan’s Low-Frequency Trading method described in his article in this issue holds a position in one or more stocks, exchange traded funds (ETFs), or indexes according to the trend of the cumulative advance-decline indicator. When the indicator is above its moving average, the method holds long, or else it stays out of the markets.
To model this in Blox, we need price data for one or more markets or indexes to invest in when the trend of the cumulative advance-decline line is up, and we need advance-decline data in a file format that Trading Blox is able to interpret. This data is available from various sources. CSI is the Trading Blox preferred end-of-day data provider, and they provide it under the symbol UVDV-I (CSI market number 5500).
Alternatively, to test the exact data used in the spreadsheet accompanying the article, we can reformat the data slightly and save it as a .csv or .txt file type. To format the data for processing by Trading Blox, we create two comma-separated value (.csv) files each containing six fields, corresponding to date, open, high, low, close, and volume. The DJIA.csv file contains the date from column A in YYYYMMDD format and the index price data from column B of McEwan’s spreadsheet. The index price for the day is copied into four fields: open, high, low, and close, while a value of 100 is placed in the volume field. The DJAD.csv file is created similarly. Since there is an advance number and a decline number for each day, we copy the advance number (column C) into the open and high price fields and the decline number (column D) into the low and close price fields. Both of these data files now appear the same as any stock price file to Trading Blox, and they are ready for processing. (See Figure 12.)

FIGURE 12: TRADING BLOX, reformmating data. To test the data used in the spreadsheet accompanying McRon Ewan’s article, the data can be reformatted slightly and saved as a .csv or .txt file type for processing by Trading Blox.
Once the data is in order, the Blox scripting code to test the system is fairly straightforward. Before the test, the DJAD.csv file containing the advance-decline information is loaded so that it may be referenced during the test:
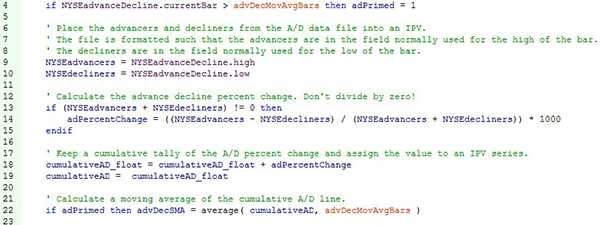
The advance-decline percent change, cumulative advance-decline line, and the moving average of the cumulative advance-decline line are calculated for each bar in the “Update indicators” script:
Once we have the data loaded and the indicators calculated, the “Entry orders” and “Exit orders” scripts (Figure 13) issue orders to go long when the cumulative advance-decline line is above its moving average and to exit if it is below its moving average.

FIGURE 13: TRADING BLOX, ENTRY AND EXIT ORDERS SCRIPTS
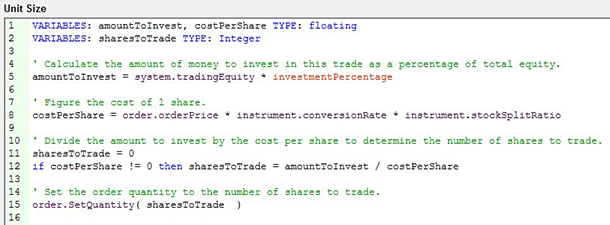
Trade size is determined by a simple money management script that invests a percentage of the account as set by the user in each trade:
The user may choose a portfolio of one or more markets to go long when the system indicates; the percentage of equity to invest in each trade; and the length of the moving average to use. The user also informs the system of the symbol used for the advance-decline data.
In Figure 14, the moving average is set to step from 50 to 300 in increments of 5.
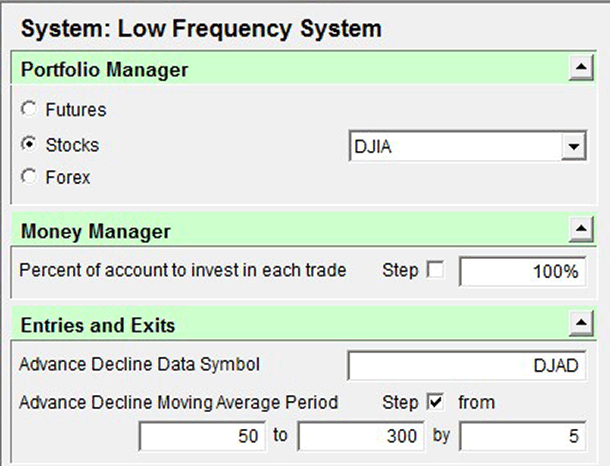
FIGURE 14: TRADING BLOX. The moving average is set to step from 50 to 300 in increments of 5.
Figure 15 shows a plot of the MAR ratio for each of the tests in this stepped parameter run. Such testing can indicate the best-performing historical parameters as well as the sensitivity of results to different parameter choices.
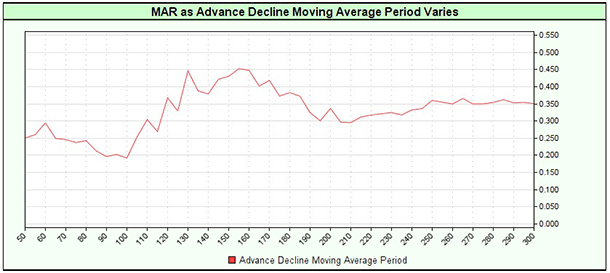
FIGURE 15: TRADING BLOX. Here is a plot of the MAR ratio for each of 51 test runs varying the days in the moving average period.
Figures 16 and 17 display the system on a chart.
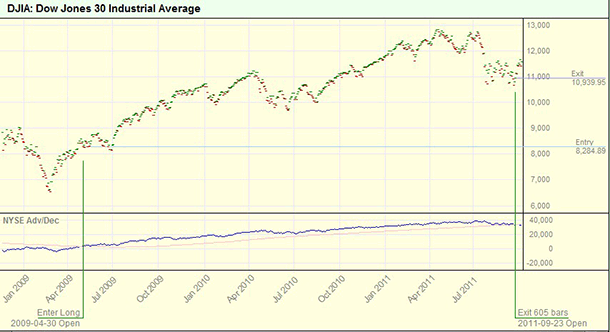
FIGURE 16: TRADING BLOX. The system stays long the Dow Jones Industrial Average (DJIA) while the cumulative advance-decline line is above its moving average and exits when it falls below it.
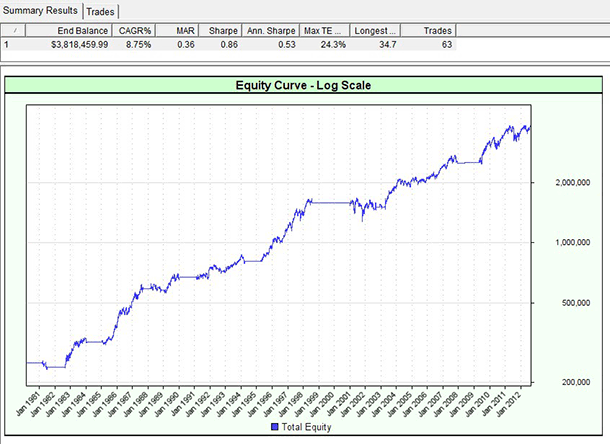
FIGURE 17: TRADING BLOX. The performance of the system since 1980 applied to the DJIA using McEwan’s moving average value of 254 bars.
—Trading Blox
www.tradingblox.com
BACK TO LIST
Originally published in the April 2013 issue of
Technical Analysis of Stocks & Commodities magazine.
All rights reserved. © Copyright 2013, Technical Analysis, Inc.
Return to
Contents


