TRADERS’ TIPS
May 2013
Here is this month’s selection of Traders’ Tips, contributed by
various developers of technical analysis software to help readers more easily
implement some of the strategies presented in this and other issues.
Other code appearing in articles in this issue is posted in the Subscriber
Area of our website at https://technical.traders.com/sub/sublogin.asp.
Login requires your last name and subscription number (from mailing label).
Once logged in, scroll down to beneath the “Optimized trading systems” area
until you see “Code from articles.” From there, code can be copied
and pasted into the appropriate technical analysis program so that no retyping
of code is required for subscribers.
You can copy these formulas and programs for easy use in your spreadsheet
or analysis software. Simply “select” the desired text
by highlighting as you would in any word processing program, then use your
standard key command for copy or choose “copy” from the browser
menu. The copied text can then be “pasted” into any open spreadsheet
or other software by selecting an insertion point and executing a paste command.
By toggling back and forth between an application window and the open web
page, data can be transferred with ease.

For this month’s Traders’ Tips, the focus is Giorgos Siligardos’ article in this issue, “Head & Shoulders, Algorithmically (Part 2).”
Code for both MetaStock and AmiBroker are already provided in Siligardos’ article, and subscribers will find this code in the Subscriber Area of our website, Traders.com. (Click on “Article Code” from our homepage.) Presented here is additional code and possible implementations for other software.

TRADESTATION: MAY 2013 TRADERS’ TIPS CODE
In “Head & Shoulders, Algorithmically (Part 2)” in this issue, author Giorgos Siligardos describes a mechanical method for detecting the classic head & shoulders chart pattern. Provided here is an indicator that identifies Siligardos’ various key points of the head & shoulders pattern. If the points meet the pattern’s conditions, a neckline is drawn and the label “HS Setup” is placed on the chart after the last bar (Figure 1). To test the code, use this sample chart setup: Symbol = EKDKQ, Bar Interval = Daily, Last Date = 3/15/2011. Use two years of data. The indicator’s default settings will produce a head & shoulders pattern for this sample chart.
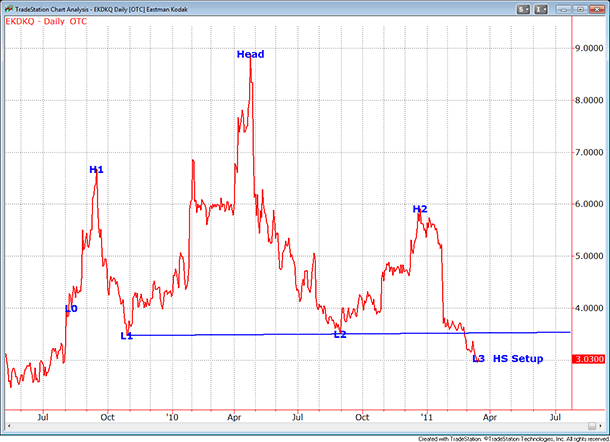
FIGURE 1: TRADESTATION. Here is a daily chart of Eastman Kodak (EKDKQ) with the indicator shown above the chart. For clarity, the indicator is set to only show the milestone points and the pattern’s neckline. The last plotted date is 3/15/2011. The chart uses two years of data.
To download the EasyLanguage code, first navigate to the EasyLanguage FAQs and Reference Posts Topic in the EasyLanguage support forum (https://www.tradestation.com/Discussions/Topic.aspx?Topic_ID=47452), scroll down, and click on the link labeled “Traders’ Tips, TASC.” Then select the appropriate link for the month and year. The ELD filename is “_TASC_HeadAndShoulders.ELD.”
_TASC_HeadAndShoulders (Indicator)
{ Head & Shoulders, Algorithmically }
{ TASC, May, 2013 }
{ Giorgos E. Siligardos, PhD }

using elsystem ;
using elsystem.collections ;

inputs:
    int N( 5 ),
    double Factor( 1 ),
    bool ShowNeckLine( true ),
    int NeckLineColor( Cyan ),
    bool ShowMilestonePoints( true ),
    bool ShowAllPoints( false ),
    int TextColor( Yellow ) ;

variables:
    bool HeadAndShoulders( false ),
    double X(0),
    int XBar(0),
    double B(0),
    int BBar(0),
    double Head(0),
    int HBar(0),
    double DPrice( 0 ),
    int DBar( 0 ),
    int RHalf( 0 ),
    double tL2( 0 ),
    int tL2Bar( 0 ),
    int LHalf( 0 ),
    double tL1( 0 ),
    int tL1Bar( 0 ),
    double H1( 0 ),
    int H1Bar( 0 ),
    double H2( 0 ),
    int H2Bar( 0 ),
    double E( 0 ),
    int EBar( 0 ),
    double F( 0 ),
    int FBar( 0 ),
    double L1Thresh( 0 ),
    double L1( 0 ),
    int L1Bar( 0 ),
    double L2Thresh( 0 ),
    double L2( 0 ),
    int L2Bar( 0 ),
    double L0Thresh( 0 ),
    double L0( 0 ),
    int L0Bar( 0 ),
    double L3Thresh( 0 ),
    double L3( 0 ),
    int L3Bar( 0 ),
    double VPt( 0 ),
    int VPtBar( 0 ),
    double W( 0 ),
    int WBar( 0 ),
    int Dist1( 0 ),
    int Dist2( 0 ),
    int Dist_0( 0 ),
    int Dist_1( 0 ),
    int Dist_2( 0 ),
    int T1( 0 ),
    int T2( 0 ),
    double J( 0 ),
    int JBar( 0 ),
    double Q( 0 ),
    int QBar( 0 ),
    double S( 0 ),
    int SBar( 0 ),
    double APt( 0 ),
    int APtBar( 0 ),
    double BPt( 0 ),
    int BPtBar( 0 ),
    bool HSCond1( false ),
    bool HSCond2( false ),
    bool HSCond3( false ),
    bool HSCond4( false ),
    bool HSCond5( false ),
    bool HSCond6( false ),
    bool HSCond7( false ),
    bool HSCond8( false ),
    bool HSCond9( false ),
    bool HSAll( false ),
    int NeckLine_TLID( 0 ),
    int PatternFound_TLID( 0 ),
    { vector of Date prices }
    Vector DateVector( NULL ),
   	{ vector of Close prices }
    Vector CloseVector( NULL ) ;

method void PtMilestoneMarker( int TextDate,
	int TextTime, double TextPrice, string Text1 )
variables: int TextNum ;
	begin
	if ShowAllPoints or ShowMilestonePoints then
		begin
		TextNum = Text_new( TextDate, TextTime,
			TextPrice, Text1 ) ;
		Text_SetStyle( TextNum, 2, 2 ) ;
		Text_SetColor( TextNum, TextColor ) ;
		end ;
	end ;


method void PtMarker( int TextDate,
	int TextTime, double TextPrice, string Text1 )
variables: int TextNum ;
	begin
	if ShowAllPoints then
		begin
		TextNum = Text_new( TextDate, TextTime,
			TextPrice, Text1 ) ;
		Text_SetStyle( TextNum, 2, 2 ) ;
		Text_SetColor( TextNum, TextColor ) ;
		end ;
	end ;

once
    begin
    clearprintlog ;
    { error checking }
    if BarType < 2 or BarType > 4 then
    	RaiseRunTimeError( "Must be a "
    		+ "Daily / Weekly / Monthly Chart" ) ;

   	DateVector = new Vector ;
    CloseVector = new Vector ;
    end ;

if BarStatus(1) = 2 then
    begin
    DateVector.insert( 0, Date ) ;
    CloseVector.insert( 0, Close ) ;
    end ;

#region MainCode
{ only check for pattern if LastBarOnChart }
if LastBarOnChart and BarStatus( 1 ) = 2 then
    begin

 #region X
    { search for X }
    X = CloseVector[0] astype double ;
	XBar = 0 ;
    for Value1 = 1 to N - 1
        begin
        if X > CloseVector[Value1] astype double then
            begin
            X = CloseVector[Value1] astype double ;
            XBar = Value1 ;
            end ;
        end ;
 	PtMarker( DateVector[XBar] astype int,
 		Time, X, "X" ) ;
 #endregion

 #region B
    { search for B }
    for Value1 = Xbar + 1 to CloseVector.Count - 1
        begin
        if CloseVector[Value1] astype double <= X then
            begin
            B = CloseVector[Value1] astype double ;
            BBar = Value1  ;
            break ;
            end ;
    	end;
    PtMarker( DateVector[BBar] astype int,
    	Time, B, "B" ) ;
 #endregion

 #region H
    { search for H }
    Head = CloseVector[XBar] astype double ;
    HBar = XBar ;
    For Value1 = XBar to BBar
        begin
        if Head < CloseVector[Value1] astype double
        	then
            begin
            Head = CloseVector[Value1] astype double ;
            HBar = Value1 ;
            end ;
        end ;
   	PtMilestoneMarker( DateVector[HBar] astype int,
   		Time, Head, "Head" ) ;
#endregion

#region D
    RHalf = HBar - XBar ;
    LHalf = IntPortion( RHalf * Factor ) ;
    DBar = XBar + RHalf + LHalf ;
    DPrice = CloseVector[DBar] astype double ;
	PtMarker( DateVector[DBar] astype int,
		Time, DPrice, "D" ) ;
 #endregion

 #region tL1
    { find tL1 - Lowest Close in
    	latest 2/3 of LHalf section }
    tL1 = CloseVector[HBar] astype double ;
    tL1Bar = HBar ;
    for Value1 = HBar to DBar -
    	IntPortion( 0.333 * ( DBar - HBar ) )
    	begin
    	if CloseVector[Value1] astype double
    		< tL1 then
    		begin
    		tL1 = CloseVector[Value1] astype double ;
    		tL1Bar = Value1 ;
    		end ;
     	end ;
    PtMarker( DateVector[tL1Bar] astype int,
    	Time, tL1, "tL1" ) ;
 #endregion

 #region tL2
	{ find tL2 - Lowest Close
		in 2/3 of distance from H to X }
    tL2 = CloseVector[HBar] astype double ;
    tL2Bar = HBar ;
    for Value1 = HBar downto XBar
    	+ IntPortion( 0.333 * ( HBar - XBar ) )
    	begin
    	if CloseVector[Value1] astype double
    		< tL2 then
    		begin
    		tL2 = CloseVector[Value1] astype double ;
    		tL2Bar = Value1 ;
    		end ;
	   	end ;
    PtMarker( DateVector[tL2Bar] astype int,
    	Time, tL2, "tL2" ) ;
 #endregion

 #region H1
    { find H1 - Highest Close from
    	D point to 1/3 of distance between D & H }
    H1 = CloseVector[DBar] astype double ;
    H1Bar = DBar ;
    for Value1 = DBar downto DBar
    	- IntPortion( 0.333 * ( DBar - HBar ) )
    	begin
    	if CloseVector[Value1] astype double > H1
    		then
    		begin
    		H1 = CloseVector[Value1] astype double ;
    		H1Bar = Value1 ;
    		end ;
     	end ;
    PtMilestoneMarker( DateVector[H1Bar] astype int,
    	Time, H1, "H1" ) ;
#endregion

#region H2
    { find H2 - Highest Close from
    	X point to 1/3 of distance between X & H }
    H2 = CloseVector[XBar] astype double ;
    H2Bar = XBar ;
    for Value1 = XBar to XBar
    	+ IntPortion( 0.333 * ( HBar - XBar ) )
    	begin
    	if CloseVector[Value1] astype double > H2 then
    		begin
    		H2 = CloseVector[Value1] astype double ;
    		H2Bar = Value1 ;
    		end ;

    	end ;
    PtMilestoneMarker( DateVector[H2Bar] astype int,
    	Time, H2, "H2" ) ;
#endregion

#region E
    { find E - Lowest Close from H1 to tL1 }
   	E = CloseVector[tL1Bar + 1] astype double ;
    EBar = tL1Bar + 1;
    for Value1 = tL1Bar + 1 to H1Bar
    	begin
    	if CloseVector[Value1] astype double < E then
    		begin
    		E = CloseVector[Value1] astype double ;
    		EBar = Value1 ;
    		end ;

    	end ;
    PtMarker( DateVector[EBar] astype int,
    	Time, E, "E" ) ;
 #endregion

 #region F
    { find F - Lowest Close from tL2 to H2 }
    F = CloseVector[tL2Bar - 1] astype double ;
    FBar = tL2Bar - 1 ;
    for Value1 = tL2Bar - 1 downto H2Bar
    	begin
    	if CloseVector[Value1] astype double < F then
    		begin
    		F = CloseVector[Value1] astype double ;
    		FBar = Value1 ;
    		end ;

    	end ;
    PtMarker( DateVector[FBar] astype int,
    	Time, F, "F" ) ;
#endregion

#region L1
    { find L1 - first Close
    	below L1Thresh (see calcs below) }
    L1Thresh = ( tL1 + 2 * E ) / 3 ;
    L1 = CloseVector[ tL1Bar ] astype double ;
    L1Bar = tL1Bar ;
	for Value1 = tL1Bar + 1 to CloseVector.Count - 1
		begin
		if CloseVector[Value1] astype double
			<= L1Thresh then
			begin
			L1 = CloseVector[Value1] astype double ;
			L1Bar = Value1 ;
			break ;
			end ;
		end ;
	PtMilestoneMarker( DateVector[L1Bar] astype int,
		Time, L1, "L1" ) ;
#endregion

#region L2
   	{ find L2 - first Close
   		below L2Thresh (see calcs below) }
    L2Thresh = ( tL2 + F ) / 2 ;
    L2 = CloseVector[FBar] astype double ; ;
    L2Bar = FBar ;
	for Value1 = FBar + 1 to CloseVector.Count - 1
		begin
		if CloseVector[Value1] astype double
			<= L2Thresh then
			begin
			L2 = CloseVector[Value1] astype double ;
			L2Bar = Value1 ;
			break ;
			end ;
		end ;
    PtMilestoneMarker( DateVector[L2Bar] astype int,
    	Time, L2, "L2" ) ;
#endregion

#region L0
   	{ find L0 - first Close below
   		L2Thresh (see calcs below) }
    L0Thresh = L1 + ( H1 - L1 ) / 5 ;
    L0 = CloseVector[H1Bar] astype double ;
    L0Bar = H1Bar ;
	for Value1 = H1Bar + 1 to CloseVector.Count - 1
		begin
		if CloseVector[Value1] astype double
			<= L0Thresh then
			begin
			L0 = CloseVector[Value1] astype double ;
			L0Bar = Value1 ;
			break ;
			end ;
		end ;
    PtMilestoneMarker( DateVector[L0Bar] astype int,
    	Time, L0, "L0" ) ;
#endregion

#region L3
   	{ find L3 - first Close <= L2 }
   	L3 = CloseVector[0] astype double ;
   	for Value1 = 0 to CloseVector.Count - 1
		begin
		if CloseVector[Value1] astype double
			<= L2 then
			begin
			L3 = CloseVector[Value1] astype double ;
			L3Bar = Value1 ;
			break ;
			end ;
		end ;
    PtMilestoneMarker( DateVector[L3Bar] astype int,
    	Time, L3, "L3" ) ;
#endregion

#region VPt
{ find V - highest closing price between L0 and H1 }
	VPt = CloseVector[H1Bar] astype double ;
	VPtBar = H1Bar ;
	for Value1 = H1Bar to L0Bar
		begin
		if CloseVector[Value1] astype double
			>= VPt then
			begin
			VPt = CloseVector[Value1] astype double ;
			VPtBar = Value1 ;
			end ;
		end ;
    PtMarker( DateVector[VptBar] astype int,
    	Time, VPt, "VPt" ) ;
#endregion

 #region W
{ find W - highest closing price
	between L3 and LastBarOnChart }
	W = CloseVector[0] astype double ;
	for Value1 = 0 to L3Bar
		begin
		if CloseVector[Value1] astype double > W then
			begin
			W = CloseVector[Value1] astype double ;
			WBar = Value1 ;
			end ;
		end ;
    PtMarker( DateVector[WBar] astype int,
    	Time, W, "W" ) ;
#endregion

 #region J
{ find J - Max Closing Price in
	rightmost third of Head to L2 }
	J = CloseVector[L2Bar] astype double ;
	JBar = L2Bar ;
	for Value1 = L2Bar to L2Bar
		+ IntPortion( 0.333 * ( Head - L2Bar ) )
		begin
		if CloseVector[Value1] astype double > J then
			begin
			J = CloseVector[Value1] astype double ;
			JBar = Value1 ;
			end ;
		end ;
    PtMarker( DateVector[JBar] astype int,
    	Time, J, "J" ) ;
#endregion

 #region APt
{ find APt - High point in
	left half of L1 to Head  }
	APt = CloseVector[L1Bar] astype double ;
	APtBar = L1Bar ;
	for Value1 = L1Bar downto L1Bar
		- IntPortion( 0.5 * ( L1Bar - HBar ) )
		begin
		if CloseVector[Value1] astype double
			> APt then
			begin
			APt = CloseVector[Value1] astype double ;
			APtBar = Value1 ;
			end ;
		end ;
    PtMarker( DateVector[APtBar] astype int,
    	Time, APt, "APt" ) ;
#endregion

 #region BPt
{ find BPt - Lowest in right half of L1 to Head  }
	BPt = CloseVector[HBar] astype double ;
	BPtBar = HBar ;
	for Value1 = HBar to HBar
		+ IntPortion( 0.5 * ( L1Bar - HBar ) )
		begin
		if CloseVector[Value1] astype double
			< BPt then
			begin
			BPt = CloseVector[Value1] astype double ;
			BPtBar = Value1 ;
			end ;
		end ;
    PtMarker( DateVector[BPtBar] astype int,
    	Time, BPt, "BPt" ) ;
#endregion
 #region Q
{ find Q - Highest in left third of L2 to H2 }
	Q = CloseVector[L2Bar] astype double ;
	QBar = L2Bar ;
	for Value1 = L2Bar downto L2Bar
		- IntPortion( 0.333 * ( L2Bar - H2Bar ) )
		begin
		if CloseVector[Value1] astype double
			> Q then
			begin
			Q = CloseVector[Value1] astype double ;
			QBar = Value1 ;
			end ;
		end ;
    PtMarker( DateVector[QBar] astype int,
    	Time, Q, "Q" ) ;
#endregion

 #region S
{ find S - Lowest right third of L2 H2   }
	S = CloseVector[H2Bar] astype double ;
	SBar = H2Bar ;
	for Value1 = H2Bar to H2Bar
		+ IntPortion( 0.333 * ( L2Bar - H2Bar ) )
		begin
		if CloseVector[Value1] astype double < S then
			begin
			S = CloseVector[Value1] astype double ;
			SBar = Value1 ;
			end ;
		end ;
    PtMarker( DateVector[SBar] astype int,
    	Time, S, "S" ) ;
#endregion

#region Distance Calcs
Dist1 = H1Bar - HBar ;
Dist2 = HBar - H2Bar ;
Dist_0 = L1Bar - L2Bar ; //Dist#
Dist_1 = L0Bar - L1Bar ;
Dist_2 = L2Bar - L3Bar ;
T1 = H1Bar - L1Bar ;
T2 = L2Bar - H2Bar ;
#endregion

#region Pattern Conditions
HSCond1 = ( L1 + 0.2 * ( Head - L1 ) < H1
	and H1 < Head - 0.15 * ( Head - L1 ) )
	and ( L2 + 0.25 * ( Head - L2 ) < H2
	and H2 < Head - 0.25 * ( Head - L2 ) ) ;
HSCond2 = L1 - 0.15 * ( Head - L1 ) < L2
	and L2 < L1 + 0.40 * ( Head - L1 ) ;
HSCond3 = iffLogic( L2 > L1 + 0.2 * ( Head - L1 ),
	J < L2 + 0.7 * ( Head - L2 ), true ) ;
HSCond4 = AbsValue( ( H1 - L1 ) - ( H2 - L2 ) )
	< Minlist ( H1 - L1, H2 - L2 ) ;
HSCond5 = ( ( H1 - L1 ) > 0.25 * ( Head - L1 )
	and ( H2 - L2 ) > 0.25 * ( Head - L2 ) )
	or ( Minlist( T1, T2 ) > 0.25 * Dist_0 ) ;
HSCond6 = ( 2.5 * MinList( Dist1, Dist2 )
	> MaxList( Dist1, Dist2 ) )
	and ( 3 * MinList( Dist_1, Dist_2 )
	> MaxList( Dist_1, Dist_2 ) ) ;
HSCond7 = AbsValue( APt - BPt )
	< ( Head - L1 ) / 2 ;
HSCond8 = ( Q <= L2 + 0.8 * ( H2 - L2 ) )
	or ( S >= L2 + 0.5 * ( H2 - L2 ) ) ;
HSCond9 = ( W < L3 + ( H2 - L3 ) / 3 )
	and ( VPt < Head - 0.15 * ( Head - L1 ) ) ;

HSAll = HSCond1 and HSCond2 and HSCond3
	and HSCond4 and HSCond5	and HSCond6
	and HSCond7 and HSCond8 and HSCond9 ;

if HSAll then
	begin
	PatternFound_TLID = Text_New( Date ,
		Time, Close, Spaces( 4 ) + "HS Setup" ) ;
	if PatternFound_TLID > 0 then
		begin
		Text_SetColor( PatternFound_TLID,
			TextColor ) ;
		Text_SetStyle( PatternFound_TLID, 0, 2 ) ;
		end ;
	If ShowNeckLine then
		NeckLine_TLID = TL_New( Date[L1Bar],
			Time, L1, Date[L2Bar], Time, L2 ) ;
	If NeckLine_TLID > 0 then
		begin
		TL_SetExtRight( NeckLine_TLID, true ) ;
		TL_SetColor( NeckLine_TLID, NeckLineColor ) ;
		end ;
	end ;
#endregion

end ; { LastBarOnChart }

#endregion
This article is for informational purposes. No type of trading or investment recommendation, advice, or strategy is being made, given, or in any manner provided by TradeStation Securities or its affiliates.
—Doug McCrary
TradeStation Securities, Inc.
www.TradeStation.com
BACK TO LIST

eSIGNAL: MAY 2013 TRADERS’ TIPS CODE
For this month’s Traders’ Tip, we’ve provided the formula HandS_Indicator.efs based on Giorgos Siligardos article in this issue, “Head & Shoulders, Algorithmically (Part 2).”
The study contains formula parameters to set the price source, maximum pattern length, line color, and line size, which may be configured through the Edit Chart window.
To discuss this study or download a complete copy of the formula code, please visit the EFS Library Discussion Board forum under the Forums link from the Support menu at www.esignal.com or visit our EFS KnowledgeBase at www.esignal.com/support/kb/efs/. The eSignal formula scripts (EFS) are also available for copying and pasting below.
/*********************************
Provided By:
    Interactive Data Corporation (Copyright © 2013)
    All rights reserved. This sample eSignal Formula Script (EFS)
    is for educational purposes only. Interactive Data Corporation
    reserves the right to modify and overwrite this EFS file with
    each new release.

Description:
    HandS Indicator

Version:            1.00  18/03/2013

Formula Parameters:                     Default:
Price Source                            Close
Max Pattern Length                      200
Line Color                              red
Line Size                               2

Notes:
    The related article is copyrighted material. If you are not a subscriber
    of Stocks & Commodities, please visit www.traders.com.

**********************************/

var fpArray = new Array();

function preMain()
{
    setPriceStudy(true);
    setStudyTitle("HandS Indicator");

    setComputeOnClose();

    var x = 0;

    fpArray[x] = new FunctionParameter("fpPriceSource", FunctionParameter.STRING);
    with(fpArray[x++])
    {
        setName("Price Source");
        addOption("Open");
        addOption("Close");
        addOption("Low");
        addOption("High");
        addOption("HL/2");
        addOption("HLC/3");
        addOption("OHLC/4");
        setDefault("Close");
    }

    fpArray[x] = new FunctionParameter("fpMaxLength", FunctionParameter.NUMBER);
    with(fpArray[x++])
    {
        setName("Max Pattern Length");
        setLowerLimit(1);
        setDefault(200);
    }

    fpArray[x] = new FunctionParameter("fpLineColor", FunctionParameter.COLOR);
    with(fpArray[x++])
    {
        setName("Line Color");
        setDefault(Color.red);
    }

    fpArray[x] = new FunctionParameter("fpLineSize", FunctionParameter.NUMBER);
    with(fpArray[x++])
    {
        setName("Line Size");
        setDefault(2);
    }
}


var bInit = false;
var bVersion = null;

var nPrev_HSDuration = 0;
var pUsedPoints = new Array();

var xSrc = null;

var nLinesCntr = 0;

function main(fpPriceSource, fpMaxLength, fpLineColor, fpLineSize)
{
    if (bVersion == null) bVersion = verify();
    if (bVersion == false) return;

    if(!bInit)
    {
        switch (fpPriceSource)
        {
            case 'Open':
               xSrc = open();
               break;
            case 'Close':
               xSrc = close();
               break;
            case 'High':
               xSrc = high();
               break;
            case 'Low':
               xSrc = low();
               break;
            case 'HL/2':
               xSrc = hl2();
               break;
            case 'HLC/3':
               xSrc = hlc3();
               break;
            case 'OHLC/4':
               xSrc = ohlc4();
               break;
            default : return;
        }

        bInit = true;
    }

    if(getBarState() == BARSTATE_ALLBARS)
    {
        pUsedPoints = new Array();
        nPrev_HSDuration = 0;
    }

    var nNumBars = getCurrentBarCount();

    var p1 = llv(5, xSrc).getValue(0);
    if (p1 == null) return;

    var fac = 1;

    var nBarSince = -LastBarIndexWhen(function(i){return xSrc.getValue(i) < p1;});
    if (nBarSince == null) return;

    var He = hhv(Math.max(1, nBarSince), xSrc).getValue(0);
    if (He == null) return;

    var Heb = LastBarIndexWhen(function(i){return xSrc.getValue(i) == He;});

    var Rhalf = Math.max(1, -Heb);
    var Lhalf = fac * Rhalf;

    var b0b = Math.min(-Rhalf -Lhalf, -nBarSince);

    var tL1 = llv(Math.max(1, Int(2 * Lhalf / 3)), xSrc).getValue(-Rhalf);
    if (tL1 == null) return;

    var tL1b = LastBarIndexWhen(function(i){return xSrc.getValue(i - Rhalf) == tL1;}) - Rhalf;

    var H1 = hhv(Math.max(1, Math.abs(tL1b - b0b)), xSrc).getValue(tL1b);
    if (H1 == null) return;

    var H1b = LastBarIndexWhen(function(i){return xSrc.getValue(i + tL1b) == H1;}) + tL1b;

    var eltimi = llv(Math.max(1, Math.abs(tL1b - H1b)), xSrc).getValue(tL1b);
    if (eltimi == null) return;

    var L1b = LastBarIndexWhen(function(i){return xSrc.getValue(i + tL1b) <= ((tL1 + 2 * eltimi) / 3);}) + tL1b;
    if(L1b == null || L1b > 0) return;

    var L1 =  xSrc.getValue(L1b);

    var L2 = llv(Math.max(1, 2 * Int(Rhalf / 3)), xSrc).getValue(-Int(Rhalf / 3));
    if (L2 == null) return;

    var L2b = LastBarIndexWhen(function(i){return xSrc.getValue(i - Int(Rhalf / 3)) == L2;}) - Int(Rhalf / 3);

    var H2 = hhv(Math.max(1, -L2b), xSrc).getValue(0);
    if (H2 == null) return;

    var H2b = LastBarIndexWhen(function(i){return xSrc.getValue(i) == H2;});

    var L3b = LastBarIndexWhen(function(i){return i > H2b && xSrc.getValue(i) <= L2;});
    if(L3b == null || L3b > 0) return;

    var L0b = LastBarIndexWhen(function(i){return xSrc.getValue(i + H1b) <= L1 + 0.2 * (H1 - L1);}) + H1b;
    if(L0b == null || L0b > 0) return;

    var L0 = xSrc.getValue(L0b);

    var L3 = xSrc.getValue(L3b);

// ================== CHECK FOR H&S PATTERN ======================

    var bExpr1 = H1 > (L1 + 0.20 * (He - L1));
    var bExpr2 = H1 < (He - 0.15 * (He - L1));
    var bExpr3 = H2 > (L2 + 0.25 * (He - L2));
    var bExpr4 = H2 < (He - 0.25 * (He - L2));
    var bExpr5 = L2 < (L1 + 0.40 * (He - L1));

    var bExpr6_1 = L2 > L1 + 0.20 * (He - L1);
    var bIfTrue_bExpr6_1 = hhv(Int(Math.max((Heb - L2b)/3, 1)), xSrc).getValue(L2b) < L2 + 0.7 * (He - L2);
    var bExpr6 = bExpr6_1 ? bIfTrue_bExpr6_1 : true;

    var bExpr7 = L2 > (L1 - 0.15 * (He - L1));
    var bExpr8 = Math.abs((H1 - L1) - (H2 - L2)) < Math.min(H1 - L1, H2 - L2);

    var nVal9_1 = hhv(Math.max(1, Int((L1b - Heb)/2)), xSrc).getValue(-Int(Rhalf + (L1b - Heb)/2));
    var nVal9_2 = llv(Math.max(1, Int((Heb - L1b)/2)), xSrc).getValue(-Int(Rhalf));
    var bExpr9 = Math.abs(nVal9_1 - nVal9_2) < (He - L1)/2;

    var bExpr10 = hhv(Math.max(1, -L3b), close()).getValue(0) < L3 + (H2 - L3)/3;

    var bExpr11_1 = hhv(Math.max(1, Int((H2b - L2b)/3)), xSrc).getValue(H2b - Int(2*(H2b - L2b)/3)) > (L2 + 0.8 * (H2 - L2))
    var bExpr11_2 = llv(Math.max(1, Int((H2b - L2b)/3)), xSrc).getValue(H2b) < (L2 + 0.25 * (H2 - L2));
    var bExpr11 = (bExpr11_1 && bExpr11_2) == false;

    var bExpr12_1 = (H1 - L1) > 0.25 * (He - L1);
    var bExpr12_2 = (H2 - L2) > 0.25 * (He - L2);
    var bExpr12_3 = Math.min((L1b - H1b), (H2b - L2b)) > 0.25 * (L2b - L1b);
    var bExpr12 = (bExpr12_1 && bExpr12_2) || bExpr12_3;

    var bExpr13 = hhv(Math.max(1, H1b - L0b), xSrc).getValue(H1b) < (He - 0.15 * (He - L1));

    var bExpr14 = 2.5 * Math.min(Heb - H1b, H2b - Heb) > Math.max(Heb - H1b, H2b - Heb);
    var bExpr15 = 3 * Math.min(L1b - L0b, L3b - L2b) > Math.max(L1b - L0b, L3b - L2b);

    var bExpr16 = (L0b != null) && (L0b <= 0) && (-L0b <= nNumBars);

    var nHSDuration = 0;

    if
    (
        bExpr1 &&
        bExpr2 &&
        bExpr3 &&
        bExpr4 &&
        bExpr5 &&
        bExpr6 &&
        bExpr7 &&
        bExpr8 &&
        bExpr9 &&
        bExpr10 &&
        bExpr11 &&
        bExpr12 &&
        bExpr13 &&
        bExpr14 &&
        bExpr15 &&
        bExpr16
    )
        nHSDuration = Math.abs(L3b - L0b);
// ===============================================================

    if (nHSDuration > fpMaxLength)
        return;

    if (nHSDuration > 0 && (nHSDuration - nPrev_HSDuration) > 1)
    {
        var pPatternLines = new Array();
        pPatternLines.push(new Line(L0b, H1b));
        pPatternLines.push(new Line(H1b, L1b));
        pPatternLines.push(new Line(L1b, Heb));
        pPatternLines.push(new Line(Heb, L2b));
        pPatternLines.push(new Line(L2b, H2b));
        pPatternLines.push(new Line(H2b, L3b));

        var pCurrentPoints = new Array();
        pCurrentPoints.push(nNumBars + L0b);
        pCurrentPoints.push(nNumBars + L1b);
        pCurrentPoints.push(nNumBars + L2b);
        pCurrentPoints.push(nNumBars + L3b);
        pCurrentPoints.push(nNumBars + H1b);
        pCurrentPoints.push(nNumBars + H2b);
        pCurrentPoints.push(nNumBars + Heb);

        var color = fpLineColor;

        var getColor = function(n)
        {
            var r = 2*n % 250;
            var g = 250 - 2*n % 250;
            var b = 5*n % 250;
            return color = Color.RGB(r, g, b);
        }

        if (CheckForRepeatedPoints(pCurrentPoints))
            color = getColor(color % 250 * nLinesCntr % 250);

        DrawPatternLines(pPatternLines, xSrc, fpLineSize, color);

        for(var pointKey in pCurrentPoints)
            pUsedPoints.push(pCurrentPoints[pointKey]);
    }

    nPrev_HSDuration = nHSDuration;
}

function CheckForRepeatedPoints(pPoints)
{
    for(var pointKey in pPoints)
    {
        for (var usedPointKey in pUsedPoints)
        {
            if (pUsedPoints[usedPointKey] == pPoints[pointKey])
                return true;
        }
    }

    return false;
}

function Line(nStart, nEnd)
{
    this.Start = nStart;
    this.End = nEnd;
}

function DrawLine(oLine, xSeries, nThikness, nColor, sKey)
{
    drawLineRelative
    (
        oLine.Start,
        xSeries.getValue(oLine.Start),
        oLine.End,
        xSeries.getValue(oLine.End),
        PS_SOLID,
        nThikness,
        nColor,
        sKey
    )
}

function DrawPatternLines(pLines, xSeries, nThikness, nColor)
{
    for (var key in pLines)
    {
        DrawLine(pLines[key], xSeries, nThikness, nColor, nLinesCntr++);
    }
}

function LastBarIndexWhen(fExpr)
{
    for (var i = 0; i < getCurrentBarCount(); i++)
    {
        if (fExpr(-i))
            return - i;
    }

    return null;
}

function Int(nNumber)
{
    return Math.floor(nNumber);
}

// Verify eSignal version
function verify()
{
    var b = false;
    if (getBuildNumber() < 779)
    {
        drawTextAbsolute(5, 35, "This study requires version 8.0 or later.",
            Color.white, Color.blue, Text.RELATIVETOBOTTOM|Text.RELATIVETOLEFT|Text.BOLD|Text.LEFT,
            null, 13, "error");
        drawTextAbsolute(5, 20, "Click HERE to upgrade.@URL=https://www.esignal.com/download/default.asp",
            Color.white, Color.blue, Text.RELATIVETOBOTTOM|Text.RELATIVETOLEFT|Text.BOLD|Text.LEFT,
            null, 13, "upgrade");
        return b;
    }
    else
    {
        b = true;
    }

    return b;
}
A sample chart is shown in Figure 2.
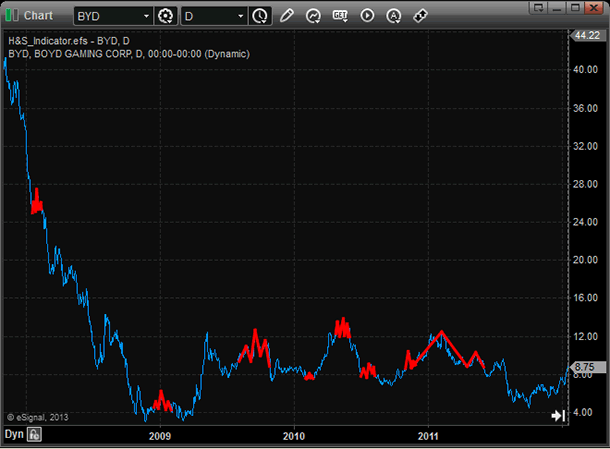
FIGURE 2: eSIGNAL. The study contains formula parameters to set the price source, max pattern length, line color, and line size, which may be configured through the Edit Chart window.
—Jason Keck
eSignal, an Interactive Data company
800 779-6555, www.eSignal.com
BACK TO LIST

WEALTH-LAB: MAY 2013 TRADERS’ TIPS CODE
Despite the fact that Giorgos Siligardos has presented a fairly complex routine for spotting head & shoulders (H&S) tops in his article in this issue, “Head & Shoulders, Algorithmically (Part 2),” this month we do not have a single code line to share! This is because Wealth-Lab already offers a built-in head & shoulders top strategy that performs detection and more. The built-in strategy’s algorithm applies peaks and troughs as a convenient way of detecting H&S chart patterns.
Basically, a head & shoulders top is composed of three peaks, with the second being higher than the outer two. Detecting peaks and troughs is performed by looking for a percentage reversal in the price series (usually high and low) greater than or equal to a specified reversal amount. For example, a reversal value of 10% detects a peak when price falls to $90 after having set a new high at $100.
We feel this algorithm solves the problem of catching H&S tops as efficiently as the one by Siligardos but is programmed in a more intuitive manner and without the added complexity. While having great flexibility and precision in spotting H&S chart patterns is good, “overshaping” it with extra conditions may decrease the amount of signals. In addition, each extra variable and constant inevitably adds a degree of freedom into the resulting trading system.
Our mechanical trading strategy has a set of rules that enters when an imaginary neckline (that is, a line that connects the bottom of the two shoulders and extends it to the right) is broken, and to exit either for a profit on reaching an objective or for a loss when prices do a head fake. Motivated traders are welcome to try it out.
A demonstration is shown in Figure 3.
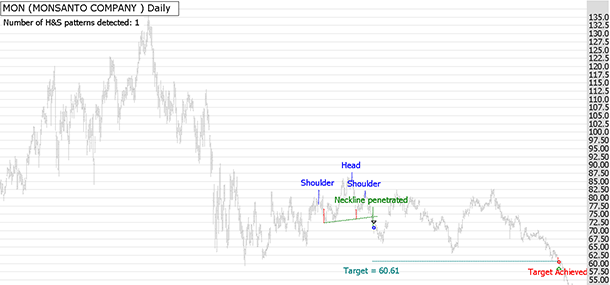
FIGURE 3: WEALTH-LAB. This Wealth-Lab 6 chart shows our own built-in head & shoulders top trading system in action on a chart of Monsanto, for comparison to Siligardos’ Figure 8 in his article in this issue.
—Wealth-Lab team
MS123, LLC
www.wealth-lab.com
BACK TO LIST

NEUROSHELL TRADER: MAY 2013 TRADERS’ TIPS CODE
The head & shoulders indicators described by Giorgos Siligardos in his article in this issue, “Head & Shoulders, Algorithmically (Part 2),” can be implemented in NeuroShell Trader using NeuroShell Trader’s ability to call external dynamic linked libraries (DLL). Dynamic linked libraries can be written in C, C++, Power Basic, or Delphi.
After coding an indicator in your preferred compiler and creating a DLL, you can insert the resulting head & shoulders indicator as follows:
- Select “New Indicator ...” from the Insert menu.
- Choose the External Program & Library Calls category.
- Select the appropriate External DLL Call indicator.
- Setup the parameters to match your DLL.
- Select the Finished button.
Users of NeuroShell Trader can go to the Stocks & Commodities section of the NeuroShell Trader free technical support website to download a copy of this or any previous Traders’ Tips.
A sample chart is shown in Figure 4.
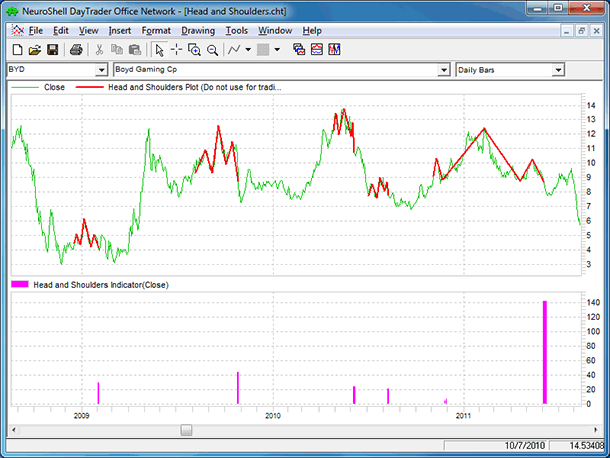
FIGURE 4: NEUROSHELL TRADER. This sample NeuroShell Trader chart shows both a recursive head & shoulders plot indicator and a recursive head & shoulders signal indicator.
—Marge Sherald, Ward Systems Group, Inc.
301 662-7950, sales@wardsystems.com
www.neuroshell.com
BACK TO LIST

AIQ: MAY 2013 TRADERS’ TIPS CODE
The AIQ code for finding head & shoulders (H&S) patterns based on Giorgos Siligardos’ article in this issue, “Head & Shoulders, Algorithmically (Part 2),” is provided at the following website: www.TradersEdgeSystems.com/traderstips.htm.
I did not directly translate the code given in Siligardos’ article into AIQ EDS code because the AIQ program has chart pattern recognition built in. The code I am providing will find H&S patterns — as well as many other patterns — for either completed or emerging patterns. In Figure 5, I show an example of a completed H&S topping pattern with the sell signal (red down arrow). The bars after the signal indicate that this trade was immediately profitable. In Figure 2, I show an example of a completed inverse H&S bottoming pattern with a buy signal (red up arrow). The bars after the signal indicate that this trade was immediately profitable.
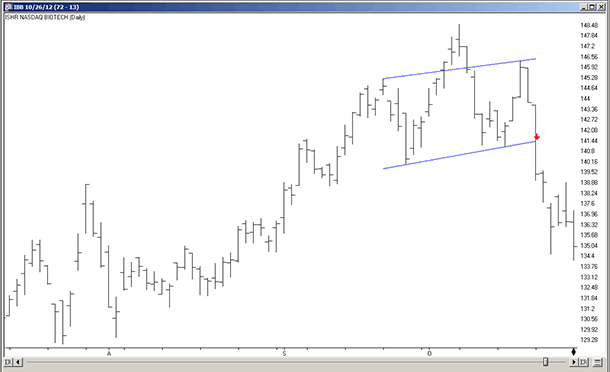
FIGURE 5: AIQ, H&S TOPPING PATTERN. Here’s an example of H&S topping pattern recognition with a sell signal (red down arrow) on iShares NASDAQ Biotechnology (IBB).
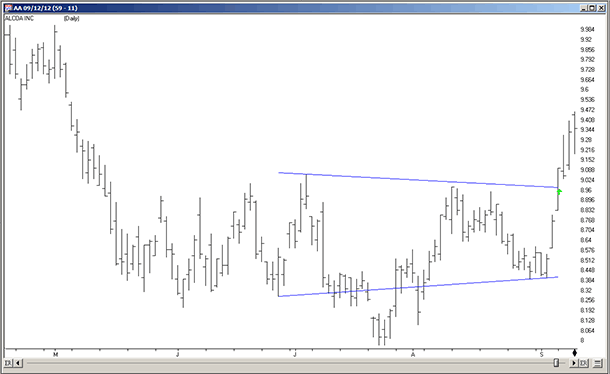
FIGURE 6: AIQ, H&S BOTTOMING PATTERN. Here’s an example of inverse H&S bottoming pattern recognition with a buy signal (red up arrow) on Alcoa (AA).
The code and EDS file can be downloaded from www.TradersEdgeSystems.com/traderstips.htm, and is shown below.
!DETECTING HEAD & SHOULDERS ALGORITHMICALLY
!Author: Giorgos E. Siligardos TASC May 2013
!Coded by: Richard Denning 3/17/2013

!USER DEFINED FUNCTIONS:
C is [close].
Name is description().

!COMPLETED HEAD & SHOULDERS PATTERN-TOPPING:
HS is [Head and Shoulders].
HS_breakoutup if HS > 0.
HS_breakoutdn if HS < 0.

!COMPLETED HEAD & SHOULDERS PATTERN-INVERTED:
iHS is [Inv Head and Shoulders].
iHS_breakoutup if iHS > 0.
iHS_breakoutdn if iHS < 0.

!EMERGING HEAD & SHOULDERS PATTERN-TOPPING:
e_HS is [eHead and Shoulders].
e_HSemerge if e_HS > 0 or e_HS < 0.

!EMERGING HEAD & SHOULDERS PATTERN-INVERTED:
e_iHS is [eInv Head and Shoulders].
e_iHSemerge if e_iHS > 0 or e_iHS < 0.

!REPORTS TO LIST ALL HEAD & SHOULDERS PATTERS:
ShowAll if C>0 and (HS <> 0 or iHS <> 0
	or e_HS <> 0 or e_iHS <>0).
—Richard Denning
info@TradersEdgeSystems.com
for AIQ Systems
BACK TO LIST

TRADERSSTUDIO: MAY 2013 TRADERS’ TIPS CODE
This Traders’ Tip is based on “The Chartmill Value Indicator” by Dirk Vandycke in the January 2013 issue of S&C. While TradersStudio is fully capable of handling the code provided in Giorgos Siligardos’ article in this issue, “Head & Shoulders, Algorithmically (Part 2), due to my personal time constraints and the large amount of code that would need to be translated and debugged, I opted to focus on another article instead.
The February and March 2013 issues of S&C contained parts 2 and 3 of Vandycke’s article series on the Chartmill value indicator (CVI).
The TradersStudio code based on Dirk Vandycke’s article is provided at the following websites:
The following code files are provided in the download:
- Function: “VALUE_SMA” returns the simple average of the median of two prices
- Function: “CHARTMILL_VALUE” returns the indicator value
- Indicator plot: “CVI_IND” is indicator code that plots the Chartmill value indicator and two horizontal lines
- System: “CVI_SYS” is a system I devised to test signals from the indicator.
The test system buys when the oscillator is below a certain level and exits when the indicator crosses above the exit buy level. The reverse rules are used for shorts. I set up a test session using the S&P futures contract (using data from Pinnacle Data). After optimizing the parameters in the system, I chose the parameter set (cviLen=10, buyLvl=-1, exitBuyLvl=0, sellLvl=1, exitSellLvl=0). In Figure 7, I show the equity curve and underwater equity curve trading one contract from 1982 to 2013. In Figure 8, I show the indicator on a chart of the S&P 500 with the buy, sell, and exits.
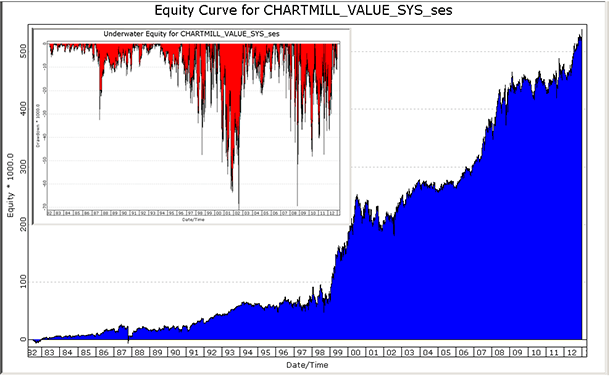
FIGURE 7: TRADERSSTUDIO. Here are sample equity and underwater equity curves for the CVI_SYS system trading one contract of the S&P 500 from 1982 through 2013.
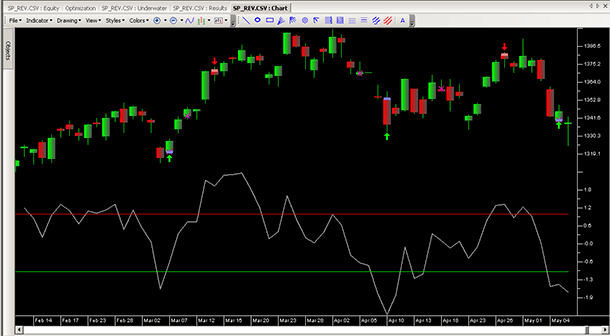
FIGURE 8: TRADERSSTUDIO. Here is the Chartmill value indicator (CVI) on a chart of the S&P 500 with a parameter length of 10.
The code is shown here:
'CHARTMILL VALUE INDICATOR
'Note: code for this article is a substitue for the May 2013
'      Traders Tips article on Head & Shoulders patterns
'Author: Dirk Vandycke TASC Jan 2013
'Coded by: Richard Denning 3/17/2013
'www.TradersEdgeSystems.com

'FUNCITON THAT RETURNS THE AVERAGE OF THE MEDIAN OF TWO PRICES:
Function VALUE_SMA(priceHigh As BarArray,priceLow As BarArray,smaLen)
VALUE_SMA = Average((priceHigh + priceLow)/2,smaLen)
End Function
'--------------------------------------------------------------------
'FUNCTION THAT RETURNS THE CHARTMILL_VALUE OR CVI:
Function CHARTMILL_VALUE(cmLen)
Dim cmVola As BarArray
Dim valueSMA As BarArray
valueSMA = VALUE_SMA(High,Low,cmLen)
cmVola = AvgTrueRange(cmLen)
CHARTMILL_VALUE = (Close - valueSMA) / max(cmVola,0.000001)
End Function
'--------------------------------------------------------------------
'INDICATOR FUCTION FOR PLOTTING THE CVI INDICATOR:
Sub CVI_IND(cmLen)
plot1(CHARTMILL_VALUE(cmLen))
plot2(1)
plot3(-1)
End Sub
'---------------------------------------------------------------------
'TRADING SYSTEM THAT USES THE CVI INDICATOR:
Sub CVI_SYS(cviLen,buyLvl,exitBuyLvl,sellLvl,exitSellLvl)
'default parameters: cviLen=10,buyLvl=-1,exitBuyLvl=0,
'                    sellLvl=1,exitSellLvl=0
Dim CVI As BarArray
CVI = CHARTMILL_VALUE(cviLen)
If CVI < buyLvl Then Buy("LE",1,0,Market,Day)
If CVI > exitBuyLvl Then ExitLong("LX","",1,0,Market,Day)
If CVI > sellLvl Then Sell("SE",1,0,Market,Day)
If CVI < exitSellLvl Then ExitShort("SX","",1,0,Market,Day)
End Sub
'--------------------------------------------------------------------
—Richard Denning
info@TradersEdgeSystems.com
for TradersStudio
BACK TO LIST

NINJATRADER: MAY 2013 TRADERS’ TIPS CODE
We have implemented the HSIdentify and HSBasicDef strategies that are presented in
“Head & Shoulders, Algorithmically (Part 2)” by Giorgos Siligardos in this issue. The indicator is available for download at www.ninjatrader.com/SC/May2013SC.zip.
Once it has been downloaded, from within the NinjaTrader Control Center window, select the menu File → Utilities → Import NinjaScript and select the downloaded file. This file is for NinjaTrader version 7 or greater.
You can review the indicator source code by selecting the menu Tools → Edit NinjaScript → Indicator from within the NinjaTrader Control Center window and selecting HSIdentify or HSBasicDef.
NinjaScript uses compiled DLLs that run native, not interpreted, which provides with the highest performance possible.
A sample chart implementing the strategy is shown in Figure 9.
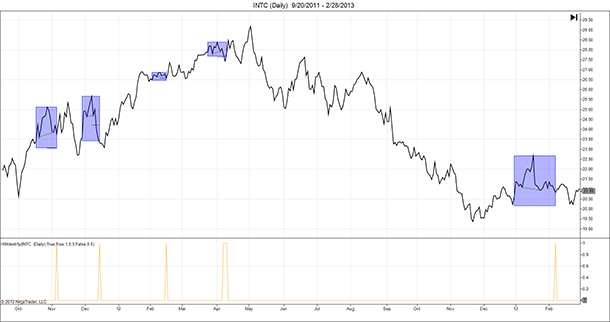
FIGURE 9: NINJATRADER. This screenshot shows the HSIdentify applied to a daily chart of Intel (INTC).
—Raymond Deux & Ryan Millard
NinjaTrader, LLC
www.ninjatrader.com
BACK TO LIST

UPDATA: MAY 2013 TRADERS’ TIPS CODE
Our Traders’ Tip this month is based on Giorgos Siligardos’ article in this issue, “Head & Shoulders, Algorithmically (Part 2).”
Updata has an existing head & shoulders pattern detector built in (Figure 10). Users can alter the geometric proportions of the head to shoulders, with real-time updating, to replicate suggestions in Siligardos’ article. Users can access this section via the scan menu and then selecting “create new highlighter.” The following definitions will assist in creating the desired pattern:
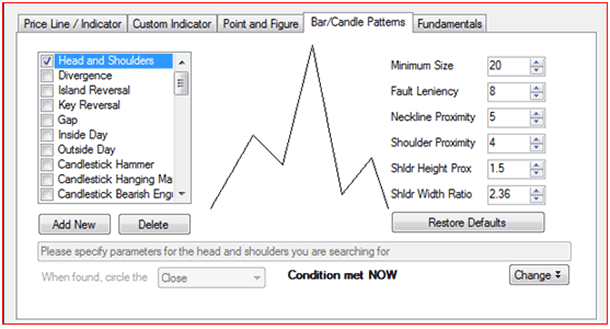
FIGURE 10: UPDATA HEAD & SHOULDERS PATTERN DETECTOR
Minimum size — The minimum number of consecutive points to the left and right that constitute a local top or bottom. For example, a minimum size of 3 means that a point with six values (three on either side) will be considered a local top if it’s less than this (or if it’s greater, it will be considered a local bottom). The H&S scanner will check for size between the value you specify and 99.
Fault leniency — The number of allowed points within the local top/bottom range that are permitted to not be greater or smaller. For example, if this is set to 1 and the minimum size to 3, then only five of the points around the local min/max need fit.
Neckline proximity — The minimum permitted base of shoulder height against the head-neckline height. A value of 5 means 1/5th of the head-neckline height is permitted.
Shoulder proximity — The minimum permitted top of shoulder height against the head-neckline height.
Shoulder height proximity — The height of one shoulder cannot exceed the other shoulder by more than this factor. A value of 1 would indicate identical height shoulders.
Shoulder width ratio — The width of each shoulder cannot exceed the width of the other shoulder by more than this factor. A value of 1 would indicate identical-width shoulders only.
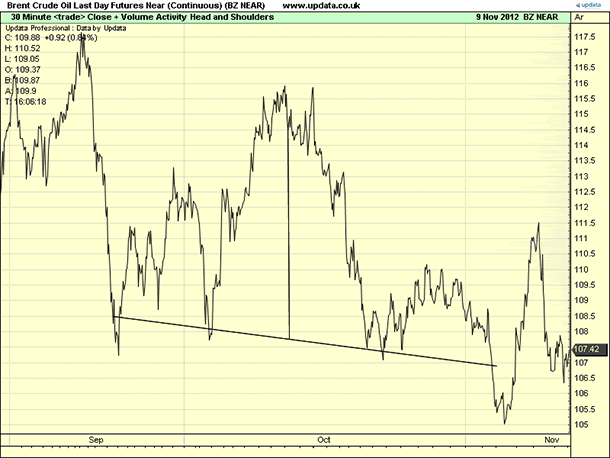
FIGURE 11: UPDATA, HEAD & SHOULDERS. Here is an example of the head & shoulders pattern as found in Brent crude futures (30-minute resolution) beginning September 2012.The head vertex and neckline is drawn.
—Updata support team
support@updata.co.uk
www.updata.co.uk
BACK TO LIST
MICROSOFT EXCEL: MAY 2013 TRADERS’ TIPS CODE
In his article in this issue, “Head & Shoulders, Algorithmically (Part 2),” author Giorgos Siligardos presents a method to set the search window size (points P1 and P2) that is reasonable to compute. He then presents the steps to identify the significant turning points and time dimensions of a well-formed head & shoulders pattern. Figure 12 approximates the pattern identified in Figure 6 in Siligardos’ article.
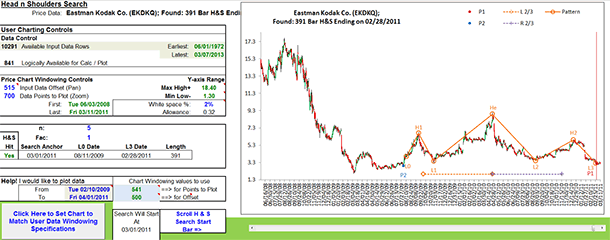
FIGURE 12: HEAD AND SHOULDERS IDENTIFIED
I use the scroll bar at the bottom of the Excel chart to manually set the right-most bar to be used in the search computations. As you slide the cursor leftward, you will see pattern hits and misses. Frequently, the exact same hit points may be found with more than one starting bar. And several patterns will start with the same L0 point; and only the L3 point will change as it is squeezed left by the cursor.
Comparing Figure 13 to Figure 12, you can see an example of the fractal nature of price behavior patterns.
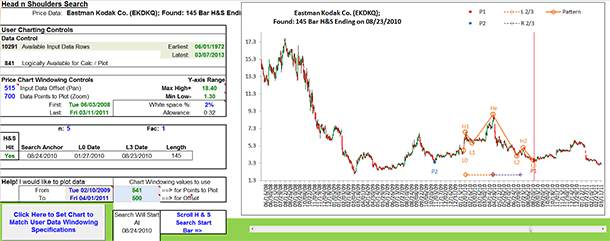
FIGURE 13: THE FRACTAL NATURE OF H&S — SMALLER INSIDE THE LARGER
Figure 14 is an example of the head & shoulders scan tab provided in the spreadsheet I am providing here.
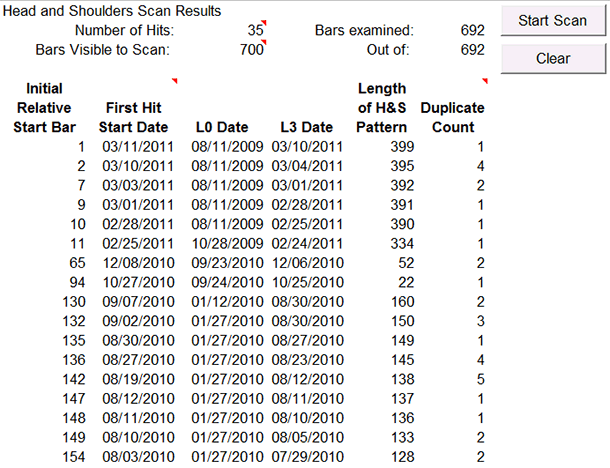
FIGURE 14: HEAD AND SHOULDERS SCAN RESULTS
I highly recommend that you have available part 1 of Siligardos’ article from the April 2013 issue of S&C as well as part 2 in this issue while you are studying the computations built into this spreadsheet.
The spreadsheet file for this Traders’ Tip can be downloaded here. To successfully download it, follow these steps:
- Right-click on the Excel file link, then
- Select “Save target as” to place a copy of the spreadsheet file on your hard drive.
—Ron McAllister
Excel and VBA programmer
rpmac_xltt@sprynet.com
BACK TO LIST

TRADING BLOX: MAY 2013 TRADERS’ TIPS CODE
In his article in this issue, “Head & Shoulders, Algorithmically (Part 2),” author Giorgos Siligardos presents an algorithm for detecting head & shoulders patterns.
The head & shoulders pattern is typically used as a reversal pattern during uptrends. An example of the head & shoulders chart pattern can be seen in Figure 15.
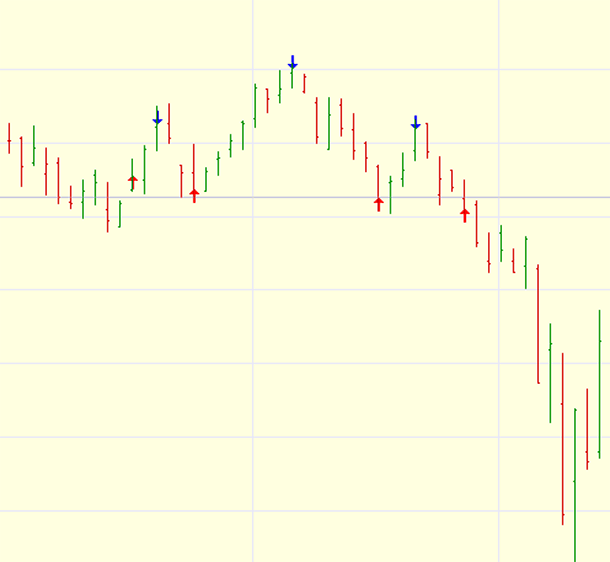
FIGURE 15: TRADING BLOX, H&S. Here’s an example of a head & shoulders chart pattern.
To code the pattern logic, I found it useful to write a custom script. A custom script acts as a function call with parameters and a return value. The head & shoulders algorithm asks in multiple instances to start at a particular bar and move backwards until a certain condition is met — in this case, when the close is lower than a given value. A loop inside a custom script is ideal for this type of problem.
First, create a custom script by clicking in the script window and selecting the menu item Scripts → New Custom. This opens the new custom script dialog in which we enter our script name. In this case, we’ll call it “MostRecentCloseLessThanEqualTo” (Figure 16).
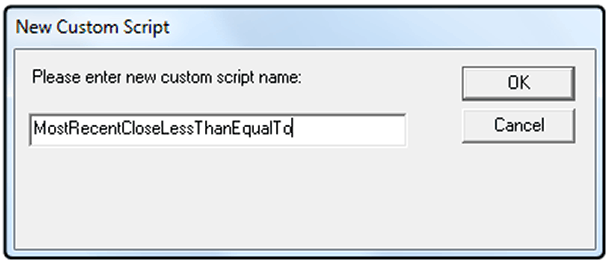
FIGURE 16: SCRIPT NAMING. Use the custom script dialog window to enter the script name. I used “MostRecentCloseLessThanEqualTo.”
Once the new script window is active, we first need to get two input variables we will be passing in (Figure 17). The first is the value to compare, and the second is the offset in number of bars. Trading Blox provides a function called script.parameterList with an index for each value. We will allow both a value and an offset or just a value to be passed into the function. This requires a check of the script.parameterCount object. If we have only one parameter, we then set the default value for the offset.
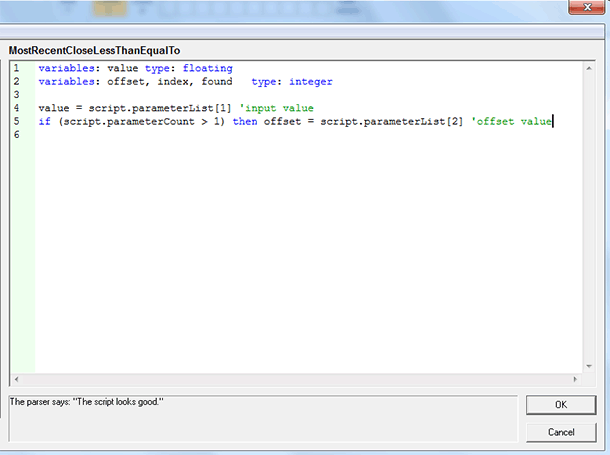
FIGURE 17: TRADING BLOX, INPUT VARIABLES. Create two input variables using the function script.parameterList.
Now we add our code to loop through each bar, check for the condition to be met, and exit if found or if we reach the beginning of the data (Figure 18). If the value is not found, we return -1 as an error condition. To return values back from the custom script, we use the script.SetReturnValue() function.
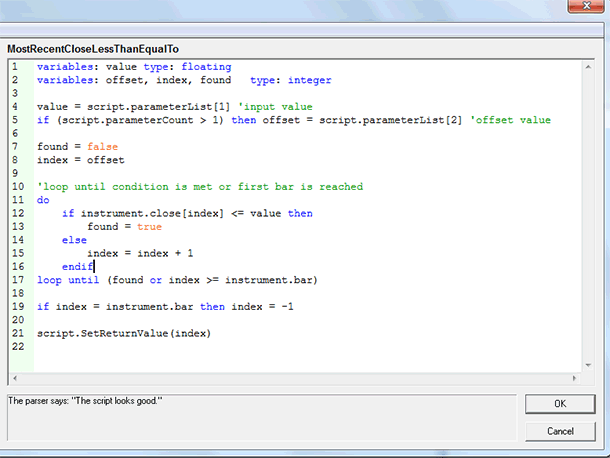
FIGURE 18: TRADING BLOX, CODE. Add in the custom code. To return values back from the custom script, we use the script.SetReturnValue() function.
To call our newly created script we use script.execute("MostRecentCloseLessThanEqualTo", X, Y), with X being the value and Y being the offset. We can also omit Y and the script will default the offset to zero.
Once we have coded the head & shoulders pattern, we can begin integrating it into a system. Failure of this pattern can be quite common in equities, especially with the upward bias of stocks. In this example, we will be using the pattern in an unconventional way, as a pullback entry into the direction of the trend. One of the most popular trend definitions is the 50-day/200-day simple moving average. When the 50-day moving average is above the 200-day moving average, the trend definition is up. We will enter long only in the direction of the trend when the head & shoulders pattern confirms. Upon entry, which will be on the open of the following day, we will place a trailing stop at three times the average true range from the close (Figure 19). Average true range is an indicator that measures volatility over a period of time (39 days).
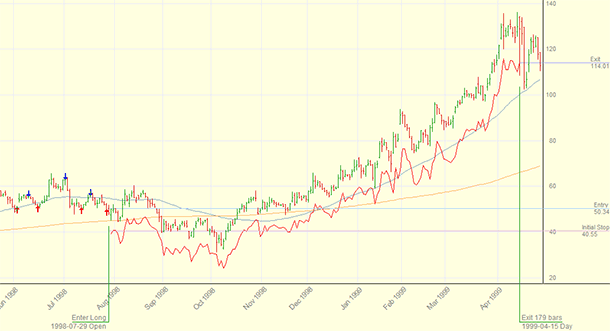
FIGURE 19: TRADING BLOX, TRAILING STOP. Place a trailing stop at three times the average true range from the close.
The portfolio we will be trading is the current membership list of the S&P 500. We will use Trading Blox’s built-in fixed fractional money manager for unit sizing (Figure 20), and because of the large portfolio size, we are risking 0.05% of the total equity on each trade. The performance results are shown in Figure 21 for simulated trading since the year 2000. This shows that almost any pattern can be used as an entry into the established trend, even one that is typically used to trade in the opposite direction.
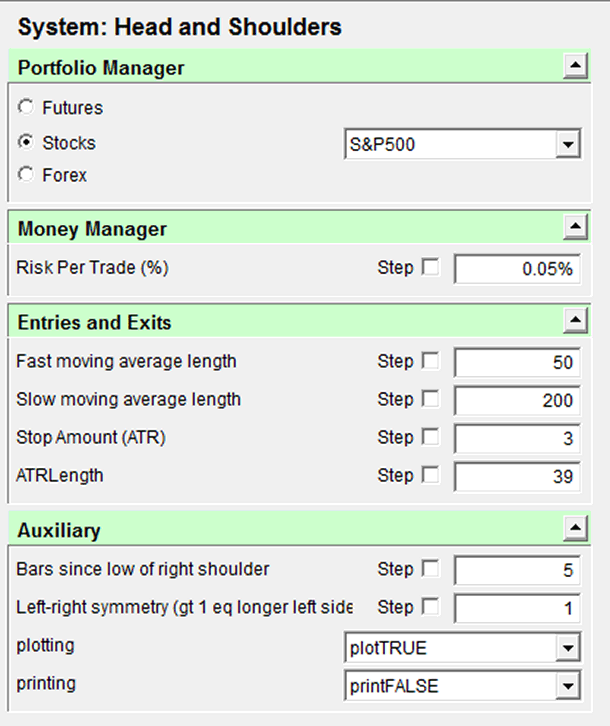
FIGURE 20: TRADING BLOX, TRADE SIZE DIALOG. We will use the built-in fixed fractional money manager for unit sizing, risking 0.05% of the total equity on each trade.
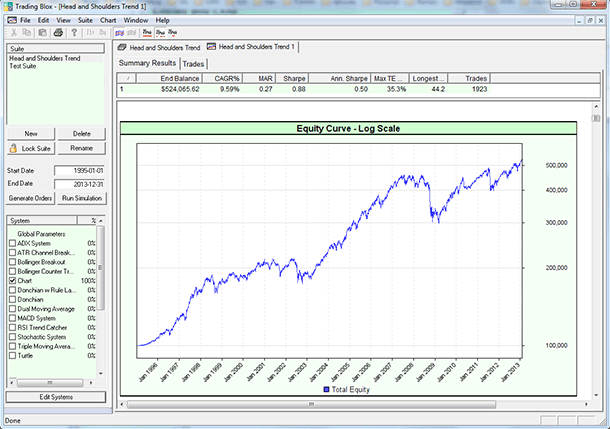
FIGURE 21: TRADING BLOX, TRADING RESULTS. Simulated trading performance since the year 2000 is shown here.
—Trading Blox
tradingblox.com
BACK TO LIST
Originally published in the May 2013 issue of
Technical Analysis of Stocks & Commodities magazine.
All rights reserved. © Copyright 2013, Technical Analysis, Inc.
Return to
Contents


