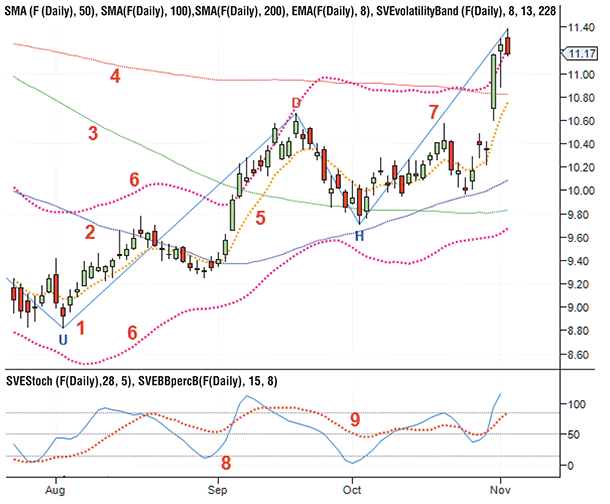
FIGURE 1: THE BASIC CHART TEMPLATE. Note the candlestick patterns at turning points, simple moving averages (SMA), exponential moving average (EMA), volatility bands, and indicators.
INDICATORS
One Step At A Time
In today’s volatile markets, making money consistently is a challenge. You need a good strategy with reliable trading rules. This seven-part series will discuss such a strategy and its trading rules. In this, the first part, an overview is presented.
Too many people believe that if they could just get their hands on some secret trading rules, making money in the stock market will be easy. You can’t blame them: They want to be like that trader who effortlessly made more than 100 pips a day using a fully automated forex trading system. On the other extreme, there are people who say that if you want to be a successful trader, you have to spend long hours studying and analyzing the markets.
WHICH SIDE SHOULD YOU BE ON?
If you want to be successful in anything, you need to work hard. But your time and effort should be well spent. For example, if you spend your time studying fundamentals, it will likely make you money in the long term, in a sustained up or down market. But in volatile markets, you may not make money consistently. This may tempt you to turn to an automated trading system, but think about this: Would you sell a system that consistently generated, say, $5,000 profit each month?
Before you can make any money, you need a trading strategy with reliable trading rules that has been shown to make money in backward and forward testing using historical data. To do that, you need to learn the basics — that is, technical analysis, money & risk management, and trading knowledge — and you need to gain experience.
I am going to put you on the right track with my indicator rules for a swing trading strategy (IRSTS). It will take a series of articles to demonstrate and explain the strategy. I will also introduce some new indicators that I use in my trading. Let’s start with an overview of the IRSTS strategy.
FIGURE 1: THE BASIC CHART TEMPLATE. Note the candlestick patterns at turning points, simple moving averages (SMA), exponential moving average (EMA), volatility bands, and indicators.