CLASSIC TECHNIQUES
Doing It My Way
Evaluation Of Stocks ETFs, And Funds
by Chris Pratsch
In times of price volatility and diverging political and financial theories on world markets, how will independent traders survive? Find out how one trader navigates the markets with a daily evaluation method.
Trading activities are controlled by organizations that trade large volumes, profit from small gains, and use ultrafast computer trading systems. Do independent retail traders have a place in such an environment?
In my article “Buy & Sell Signals Using Stochastics” published in October 2012, I discussed the advantage of buy and sell signals using variable-length stochastics. I am going to extend those ideas and incorporate them into a daily stock-evaluation method that anybody with access to a computer and printer can use.
Almost every evening after the markets close, I evaluate the entire database of my trading platform. There are about 7,500 entries. To look at each of those charts for 10 seconds would be time-consuming, which is why I use the sorting and scanning features available in my trading platform, TC2000 v12. My evaluation, when properly planned, takes about five to 10 minutes and forms the basis of my trading decisions for the next day. All formulas I have provided in this article are in the TC2000 format.
There are many ways to perform an exhaustive stock evaluation; I do not claim to know the best one, but what I do works for me. In this article I will share my approach, which I hope will help you set up an evaluation system that works for you.
IT’S THE TECHNIQUE
The purpose of evaluating stocks, exchange traded funds (ETFs), and mutual funds — I will simply refer to them as stocks in this article — is to select ideal buy or sell points. These points could be based on predetermined technical setups or fundamental data. I prefer using technical setups since I find indicators based on price, time, and volume to be more reliable than fundamental data.

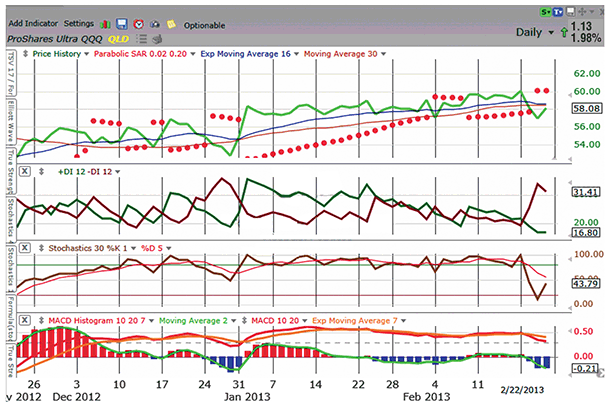
FIGURE 1: MACD/PARABOLIC SAR. On this three-month chart of QLD, the MACD 10-20-7 and MACD histogram are applied. If the histogram bars get shorter, a sell signal is imminent. If the bars get longer, a buy signal is near. You can also use the direction of the simple moving average (SMA) for your buy & sell signals.
Excerpted from an article originally published in the June
2013 issue of Technical Analysis of Stocks & Commodities magazine. All rights reserved. © Copyright 2013, Technical Analysis, Inc.
Return to Contents
