 Since You Asked
Q&A
Since You AskedConfused about some aspect of trading? Professional trader Don Bright of Bright Trading (www.stocktrading.com), an equity trading corporation, answers a few of your questions. To submit a question, post it on the Stocks & Commodities website Message-Boards. Answers will be posted there, and selected questions will appear in future issues of S&C.
THE USE OF PIVOTS
I am trying to learn more about technical analysis and trading in general. I am getting better, I think, but would like to have a decent explanation of pivot points. I see them on various websites, including yours, but I don’t know how to use them. Can you help?— Techtrdr201
I’m glad you have decided to learn more about technical analysis, and glad that you’re reading the best magazine in the field, Technical Analysis of Stocks & Commodities. Now, let’s discuss pivot points.
I post two primary factors every day to my Daily Trading Info page at Stocktrading.com. One is the daily fair value (FV) numbers. This number, provided by my friend Hank Camp (www.programtrading.com), helps us in two ways. In the premarket, we can calculate where the market will open — up or down — and by about how much. We take the closing price of the S&P 500 (SPX on my monitor) and subtract the FV number to give us what is called parity. Parity is where the market would open if everything were flat from the previous day, which rarely happens. We then subtract the actual number of S&P futures contracts. If the S&P futures indicate that the market is opening down eight SPX points, then, based on this information, we know that we will place opening-only orders on the buy side at predetermined pricing. It is similar if the market is opening up, except we sell short, counting on a retracement in both instances.
The pivot points that we use are the same levels used by the exchange floor traders and other professional futures traders. These levels tend to act as caution signs or small support & resistance levels. These levels are presented as primary pivot support levels 1,2, and 3, and resistance levels 1, 2, and 3. These levels are calculated using the previous day’s high, low, and close numbers.
Here is an example of how they can be calculated:
Pivot:
high + low + close /3
Resistance 1:
2 x pivot − low
Support 1:
2 x pivot − high
When trading, we use many simple indicators when determining entry and exit points. These pivot points work as bumpers, from which the overall market tends to bounce off, even if temporarily. If everything lines up at the same time, we obviously feel much better about our entries or exits. Hope this helps.
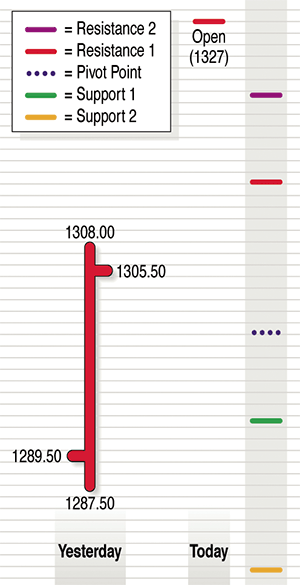
FIGURE 1: SAMPLE CHART. Here’s a demonstration of a pivot point calculated on a daily bar.
[We’ve added a chart showing a sample pivot point in Figure 1.—Editor]
IT’S FOREIGN TO ME
I am a trader in India and was wondering if US firms allow traders who are not US residents or citizens to trade US equities. I am interested in trading stocks on the New York Stock Exchange and NASDAQ. I have heard of Canadian firms in India, but none from the US. — Sundara
Thanks for the question, and yes, I am aware of some Canadian firms that have expanded into India and Asia. From what I have been told, this is now being curtailed somewhat, but I am not sure why.
Bright Trading has traders in several countries. The same basic rules apply to all our traders. They must take a Series 7 exam (no big deal), and fund their accounts appropriately (this varies). If you’re already a successful trader, then perhaps you would need risk supervision. If you would like additional training, we offer online workshops and full-fledged, weeks-long training plans. You can start studying for the Series 7 at any time, and when you’re ready, please contact us to register so we can sponsor you for your exam. There are a couple of other firms that allow overseas traders as well.