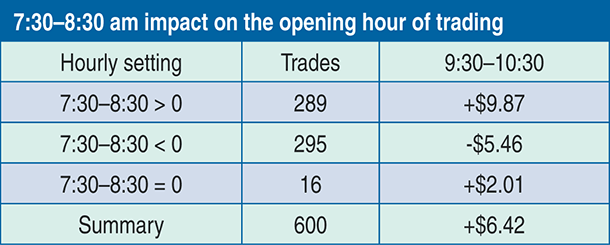
FIGURE 1: EARLY MORNING PRICE MOVEMENT. Here you see the performance of the spiders in the opening hour of trading after experiencing rising or falling prices from 7:30–8:30 am.
DAYTRADING
Let The Trades Begin
Can an analysis of early morning trading activity offer you a forecasting advantage in the opening hour of the equities market? Find out here.
When trading the spiders (SPDR S&P 500 ETF Trust) in the opening hour of the regular trading session (9:30–10:30 am ET), many daytraders overlook early morning trading volume as a forecasting indicator. Yet trading activity during the 7:30–8:30 am hour appears to have a strong impact on the direction of equities.
THE EARLY HOURS
I looked into this further and studied data from November 8, 2010, when the spiders (SPY) were at $122.37 (7:30 am) and reached a closing price of $156.24 (10:30 am) at the conclusion of this study on March 31, 2013. This spectacular run of $33.87 was impressive but the focus of my study was on trading from 9:30–10:30 am. In this opening hour, the summary performance of the spiders was $6.42 in these 600 trading days. If, however, you use early morning (7:30–8:30) trading volume as an indicator, can this performance be improved?
Before entering a trading position during the early morning hour, it’s a good policy to contrast its pricing volatility with the daily trading range (highest–lowest daily price) of $1.497. In comparison, its hourly average was $0.786. Given this disparity, you can expect wide price swings in this opening hour to deliver either strong gains or inflict massive damage.
EARLY MORNING PRICE MOVEMENT
Despite strong daily gains in the spiders, the 7:30–8:30 am hour was unable to produce a profitable trading environment; its summary loss was -$5.02 over these 600 trading days. Can you use price movements in this early hour to augment your forecasting ability? In Figure 1 you see the results the early morning price direction had on the performance of the opening hour. After a rising 7:30–8:30 am session, the summary profit in the opening hour was $9.87 in 289 trades. A declining session resulted in a loss of -$5.46 in 295 trades. But price is not the predictive indicator in this study; I am evaluating early morning trading volume as a predictor of price movements.
FIGURE 1: EARLY MORNING PRICE MOVEMENT. Here you see the performance of the spiders in the opening hour of trading after experiencing rising or falling prices from 7:30–8:30 am.