 Explore Your Options
Q&A
 Explore Your Options
Got a question about options? Tom Gentile is the chief options strategist at Optionetics (www.optionetics.com), an education and publishing firm dedicated to teaching investors how to minimize their risk while maximizing profits using options. To submit a question, post it on the Stocks & Commodities website Message-Boards. Answers will be posted there, and selected questions will appear in future issues of S&C.
GETTING ENOUGH LIQUIDITY?
On top of the list of things that option traders look at to measure liquidity is the bid/ask spread on the option they are interested in buying or selling. The thinner the spread between these two points, the more efficient the ability to buy and sell in a shorter time period, and the more likely you are to make a profit over time. I look at the bid/ask spread the way a professional gambler looks at the edge in a casino game. Casino games and option trading are not that far off; as traders, we know there are certainties we can’t overcome. The spread between what we can buy something for and what we can sell it for is one of them. Here’s how to make sure you’re trading at the closest price to the middle.
1) Look at the stock universe. There are tens of thousands of issues that trade each day, but only about 4,000 of the listed securities trade options. Which of these have the most liquidity? You may think the stocks that represent the S&P 500 basket have higher liquidity than those that do not. Going deeper, perhaps the OEX 100 or the Nasdaq 100 will give us even more traded issues, hence more liquidity. That’s a great place to start, but on an individual stock basis, it’s not going to tell you which options have the thinnest spreads. My suggestion is to look at the PPP.
What is the PPP? PPP stands for penny pilot program, which was put in place by the CBOE (Chicago Board Options Exchange) a few years back. Prior to the start of the PPP, options would trade no less than the five-cent spread (bid .95/offer 1.00). This program started with just a few stocks that started trading options in the pennies. Now there are more than 300 stocks on the penny list. This list can be found at https://www.cboe.org/hybrid/pennypilot.aspx.
2) Look at the strike universe. Option strikes are plentiful, but which ones offer the best liquidity? Let’s take a look at each type of option:
3) Look at the time universe. Expiration dates vary from a week to longer than a year. Let’s take a look at a variety of expiration dates and the average volumes among them:
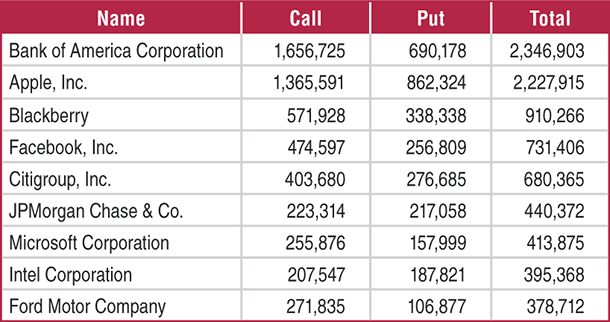
4) Look at equity option volume. The CBOE prints the top equity option volume for past months and makes this data available on its website. As I write this, Bank of America (BAC), Apple (AAPL), and Blackberry (BBRY) all rule the roost when it comes to the most calls and puts traded in March 2013 (Figure 1). There is a direct correlation between this data and how thin the spreads are between the bid & offer of these options.

FIGURE 1
Here, I have outlined many different ways to look for efficiency in the option markets, but it’s up to you to determine how this fits into your trading plan. What’s your option?