CHARTING
Up And Down They Go
In this third part of a seven-part series on indicator rules for a swing trading strategy (IRSTS), we look at how to identify a candlestick pattern that appears at turning points.
One of the rules for my swing trading strategy (IRSTS) involves recognizing a candlestick pattern at pivot points. There are several reversal patterns that could occur at these turning points, but I have observed one pattern that I could not find in the literature on candlestick patterns. In this article, I will introduce you to this pattern.
When looking for chart patterns, try not to get into the habit of looking for a specific pattern anywhere on a price chart or combining it with price averages in an up or downtrend. Instead, make sure the pattern is visible at a price turning point, preferably followed by some additional buy or sell signals. In addition, the move that follows the pattern should be large enough to make a profit.
HIGH-LOW ZIGZAG
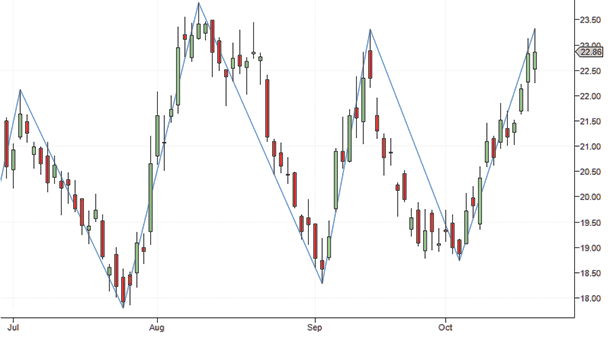
In part 2 of this article series last month, I introduced my 1-2-3 wave count using a high-low zigzag pattern on the price chart. This zigzag is a tool that identifies price turning points, and at these points you can look for candlestick patterns. When you bring up a daily chart, look for prices to move at least 10% between highs and lows. Only then can you make worthwhile profits. There should also be several such moves so you can continue to make higher profits. The chart in Figure 1 shows an example of a zigzag between the lowest low and highest high levels at pivot points triggered by a minimum low-to-high and high-to-low price change of 10%.

FIGURE 1: HIGH-LOW ZIGZAG. On this daily chart, the minimum low-to-high and high-to-low price change is 10%
THE PATTERN
Let’s take a look at the pattern I have discovered. I will start with the up reversal pattern, which I named the upstep pattern.