STATISTICS
Beyond Visual
Trading By The Numbers
by Sami Khan
Many traders are happy to backtest their trading systems, but how often do they study the statistics behind their trading setups prior to implementing a strategy? Here’s a look at how taking this step can help determine whether it’s worth developing a trading system based on an idea.
When you make a decision, chances are you will look at what happened the last time to see what to expect this time. For example, you would avoid traveling on a route to work that has been congested in the past, or you would avoid eating foods that you haven’t liked before. Similarly, if you are looking to trade based on a trading system, you would want to see past information about the system. Typically, this would be done by performing a backtest.
ARE BACKTESTS THE BEST ACTION TO TAKE?
Let’s take a step back. For simplicity, say the system you are considering will have long-only entries, and you have a well defined setup. Before performing a complete backtest of trades, ask yourself, “When I have seen this setup in the past, did the price usually go up afterward?”

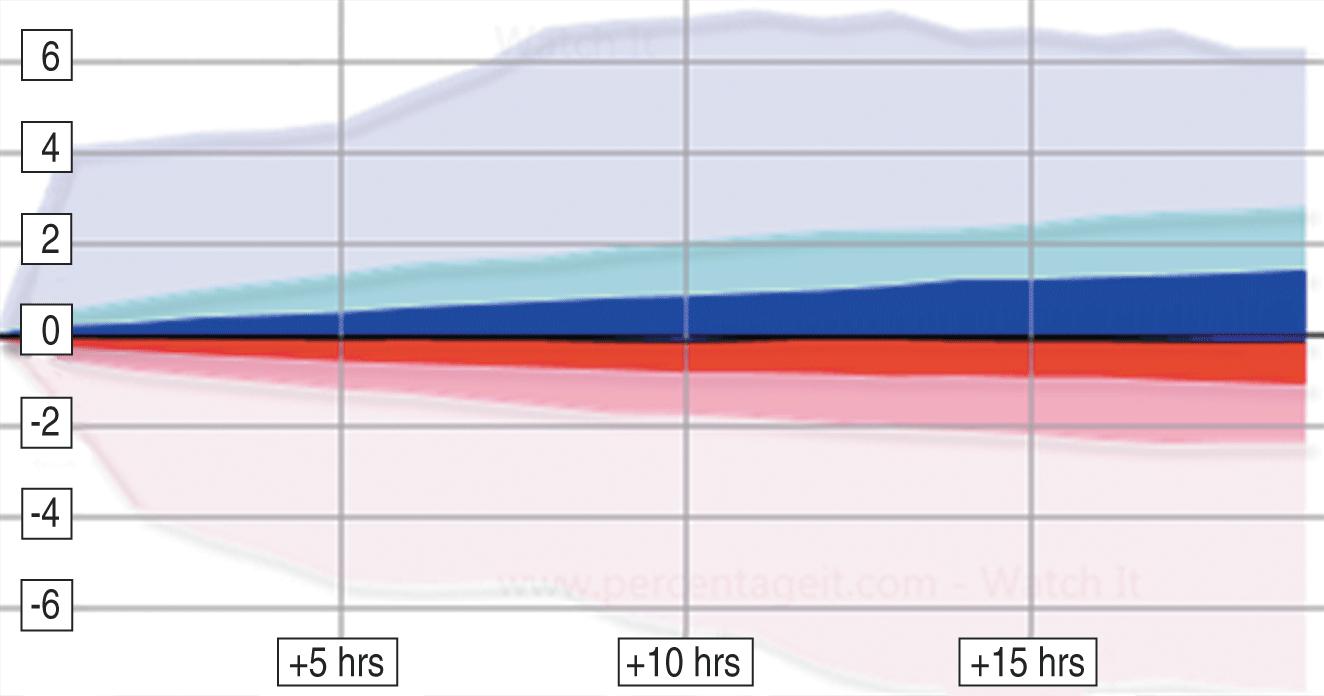
FIGURE 1: PERCENTAGE BANDS WHEN RSI HAS NOT CROSSED UP THROUGH 70 OR DOWN THROUGH 30 ON SPX HOURLY DATA. Here’s a typical result you would expect to see if you looked at a large sample of data with zero mean. The bands are centered on zero, which means there was very little price change. The inner bands are tight, showing that most of the results are clustered in the central area about the mean.
Note that I’m not talking about actual trades taken here — I’m talking about understanding the typical price distribution after a setup has occurred.
For this long-only system to be of any interest, price must have usually gone up after the setup. But what does it mean to say that price must have usually gone up? Fortunately, these days, there are huge amounts of financial data available, making it easy to find when the setup has occurred in the past. After locating an occurrence, you can look forward in the data and sample subsequent price action. Then you can perform a standard statistical test to see whether it is statistically sound to say that price is likely to go up after the setup.
Excerpted from an article originally published in the August
2013 issue of Technical Analysis of Stocks & Commodities magazine. All rights reserved. © Copyright 2013, Technical Analysis, Inc.
Return to Contents
